
Contraction, involution, low profits! Lighting exports continue to shrink. How long can trading price for volume last?
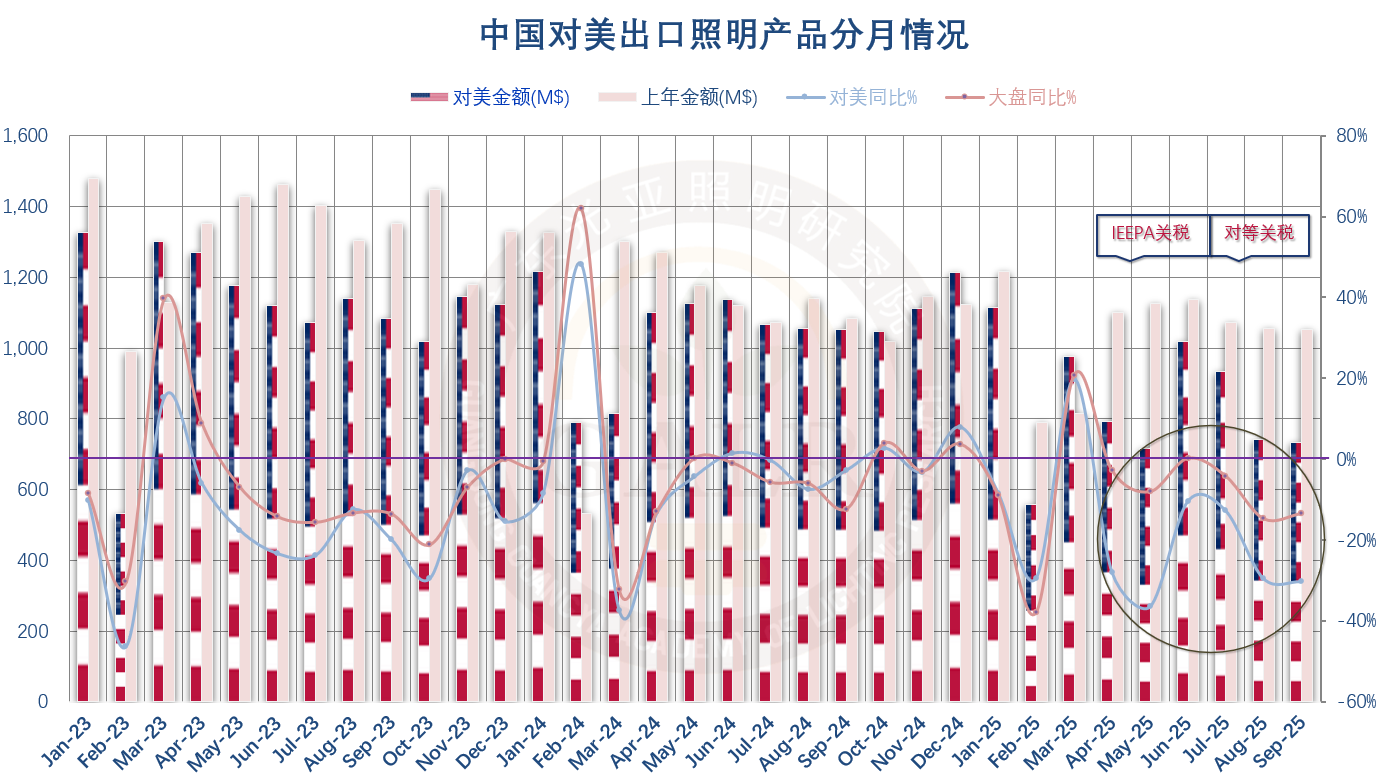
According to statistics from the General Administration of Customs, in September 2025, the total value of China's goods trade imports and exports was 4.04 trillion yuan, a year-on-year increase of 8.0%; the total export value was 2.34 trillion yuan, a year-on-year increase of 8.4%. In US dollar terms, the total import and export value was 566.7 billion US dollars, a year-on-year increase of 9.7%; the total export value was 328.6 billion US dollars, a year-on-year increase of 8.3%. Among them, monthly exports to the United States continued to decline significantly, down 27.0% year-on-year, compared to -33.1% in the previous month.
In the first three quarters of 2025, the total value of China's goods trade imports and exports was 33.61 trillion yuan, a year-on-year increase of 4.0%, with the third quarter marking the 8th consecutive quarter of year-on-year growth, and exceeding 10 trillion yuan for 10 consecutive quarters; the total export value was 19.95 trillion yuan, a year-on-year increase of 7.1%; imports were 13.66 trillion yuan, a year-on-year decrease of 0.2%. In US dollar terms, the total import and export value was 4.68 trillion US dollars, a year-on-year increase of 3.1%; of which the total export value was 2.78 trillion US dollars, a year-on-year increase of 6.1%; the total import value was 1.90 trillion US dollars, a year-on-year decrease of 1.1%.
(Click to view large image)
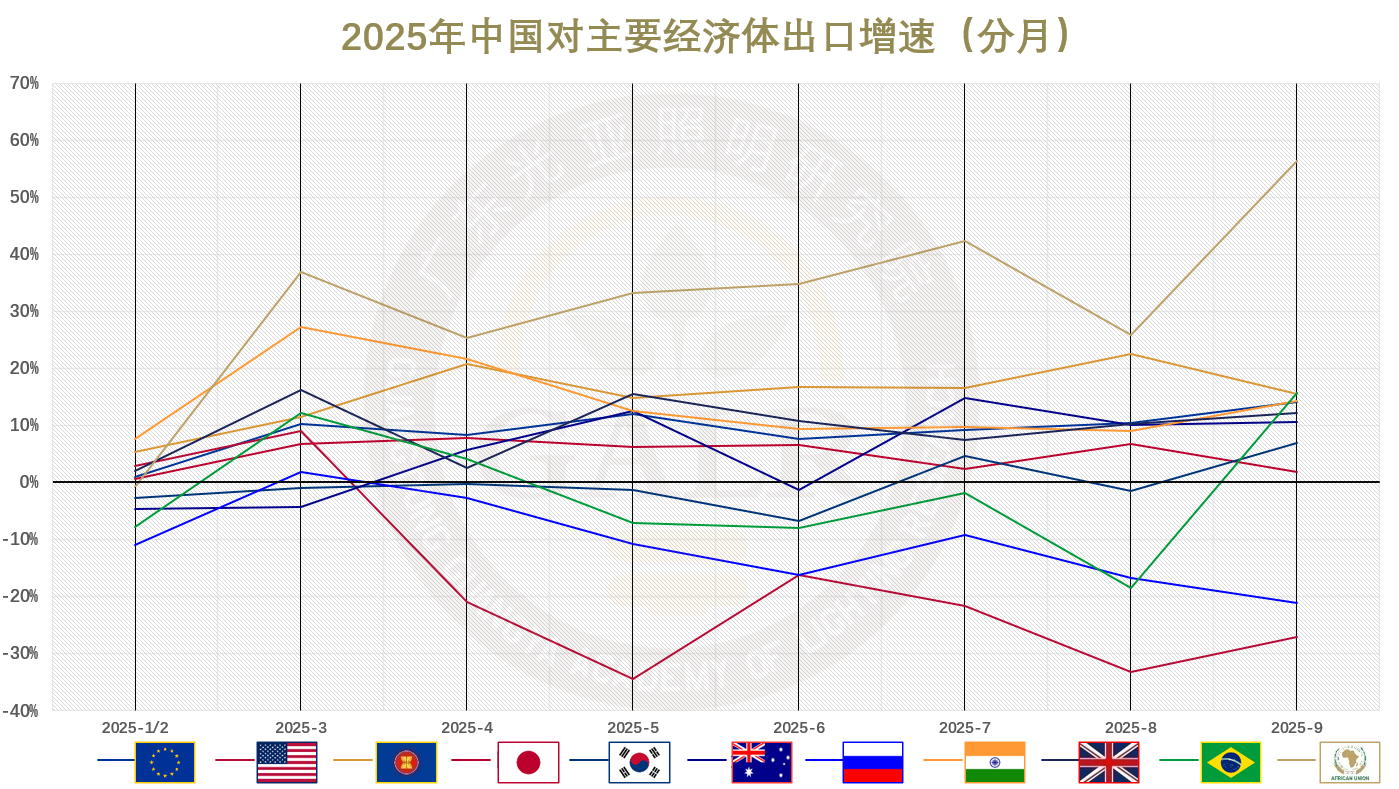
In the first three quarters of 2025, exports grew rapidly in Africa, while Europe, the UK, and India saw decent gains. Japan’s performance was lackluster, Australia, South Korea, and Brazil remained relatively sluggish, and the US and Russia became the main drags.
一方面,机电产品继续是出口强劲带动项,2025前三季度出口12.07万亿元,同比增长9.6%,增速强于出口大盘,占整体出口比重60.5%,提升了1.4个百分点。另一方面,前三季度对美出口受贸易摩擦负面影响下行16.2%,依然是整体最大拖累项,但市场多元化持续推进,新兴市场贡献了更多的增量。2025前三季度,我国对共建“一带一路”国家进出口17.37万亿元,同比增长6.2%,占进出口总值的51.7%,比重提升了1.1个百分点。对东盟、拉美、非洲、中亚等进出口分别同比增长9.6%、3.9%、19.5%和16.7%。对亚太经合组织其他经济体进出口同比增长2.0%。
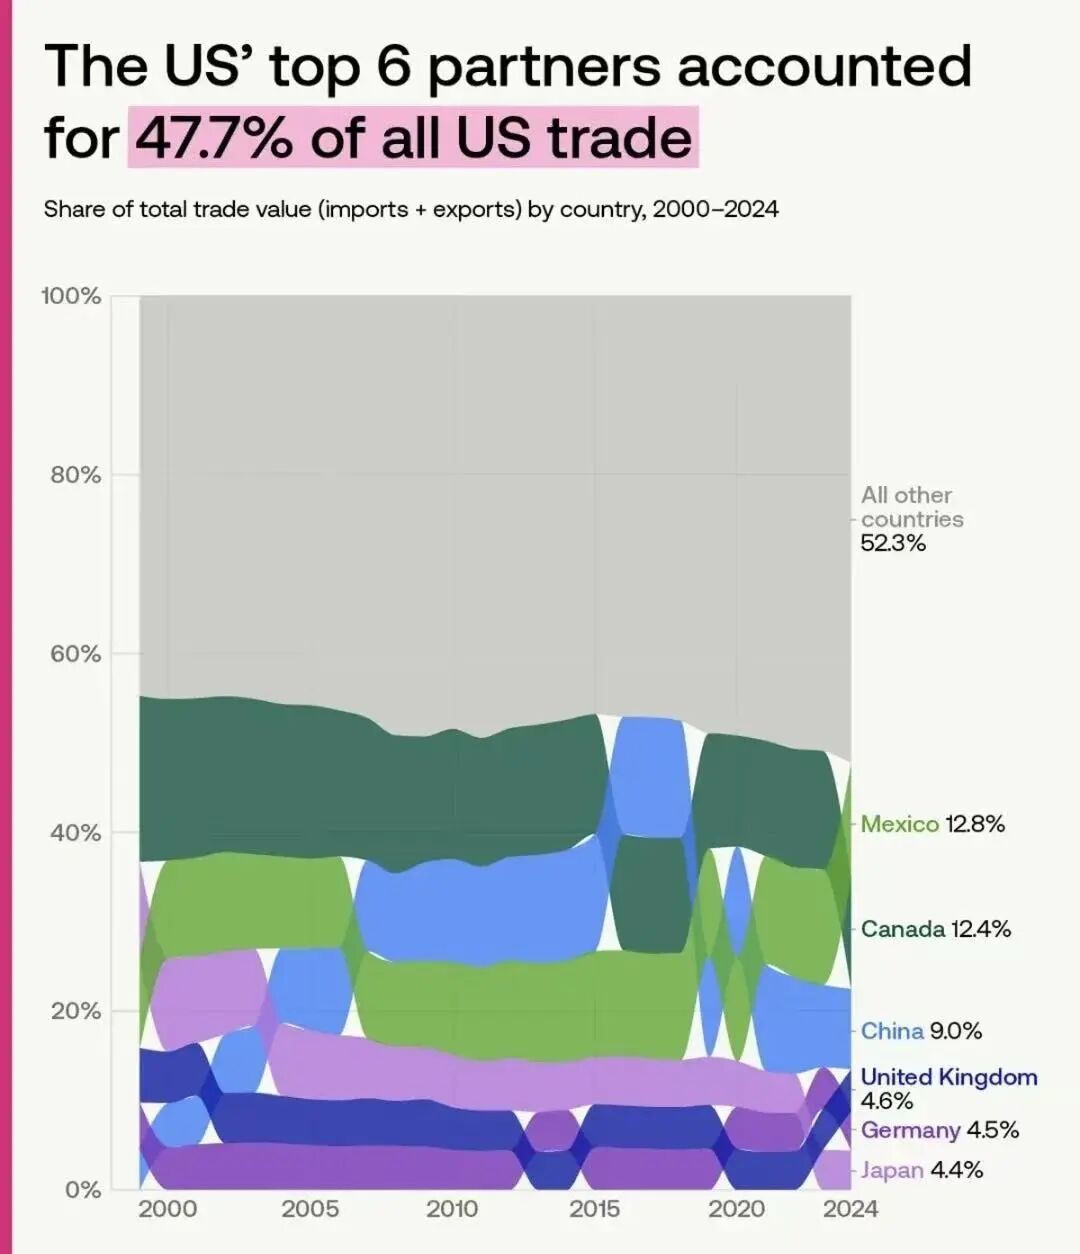
China has dropped from being the top US trading partner before the pandemic to third place, with its share falling from around 15% to 9%, almost returning to levels seen twenty years ago.
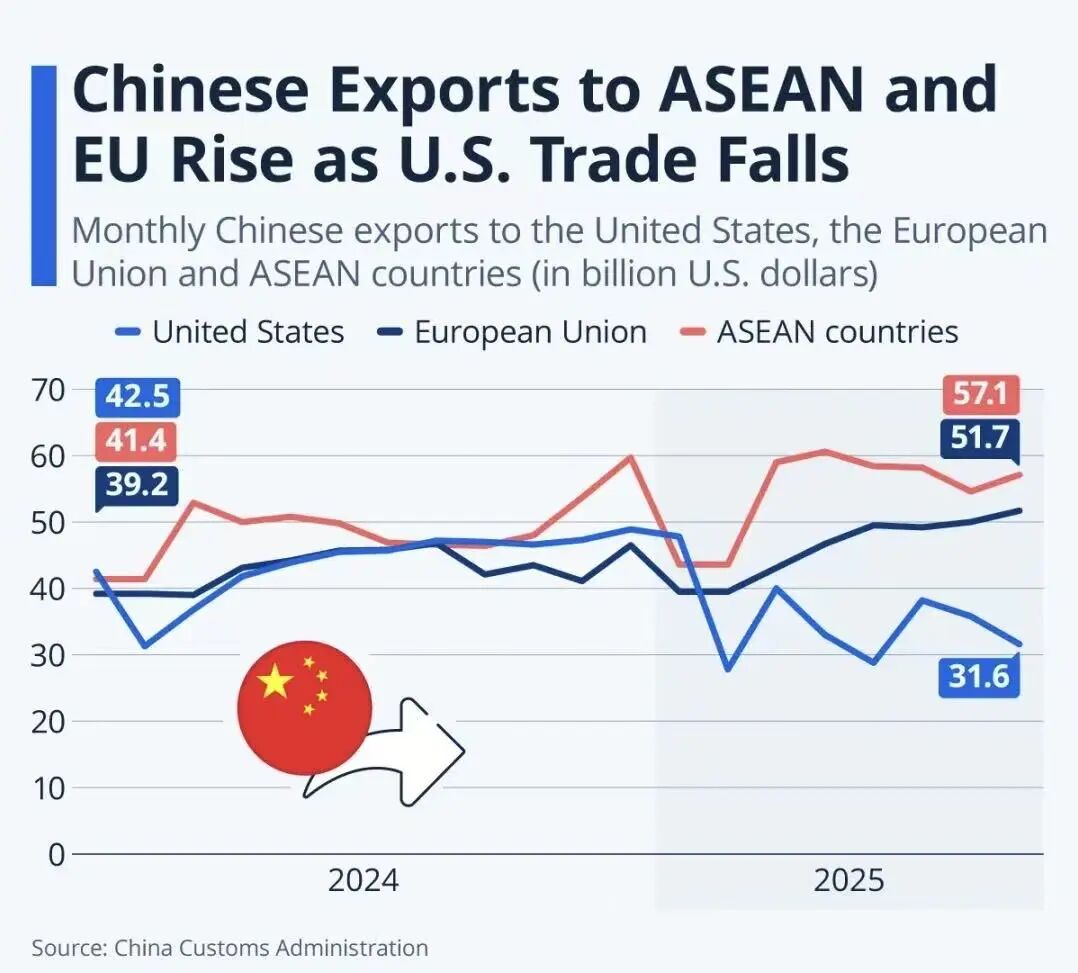
China offsets the impact of declining exports to the US with increased exports to ASEAN and the EU.
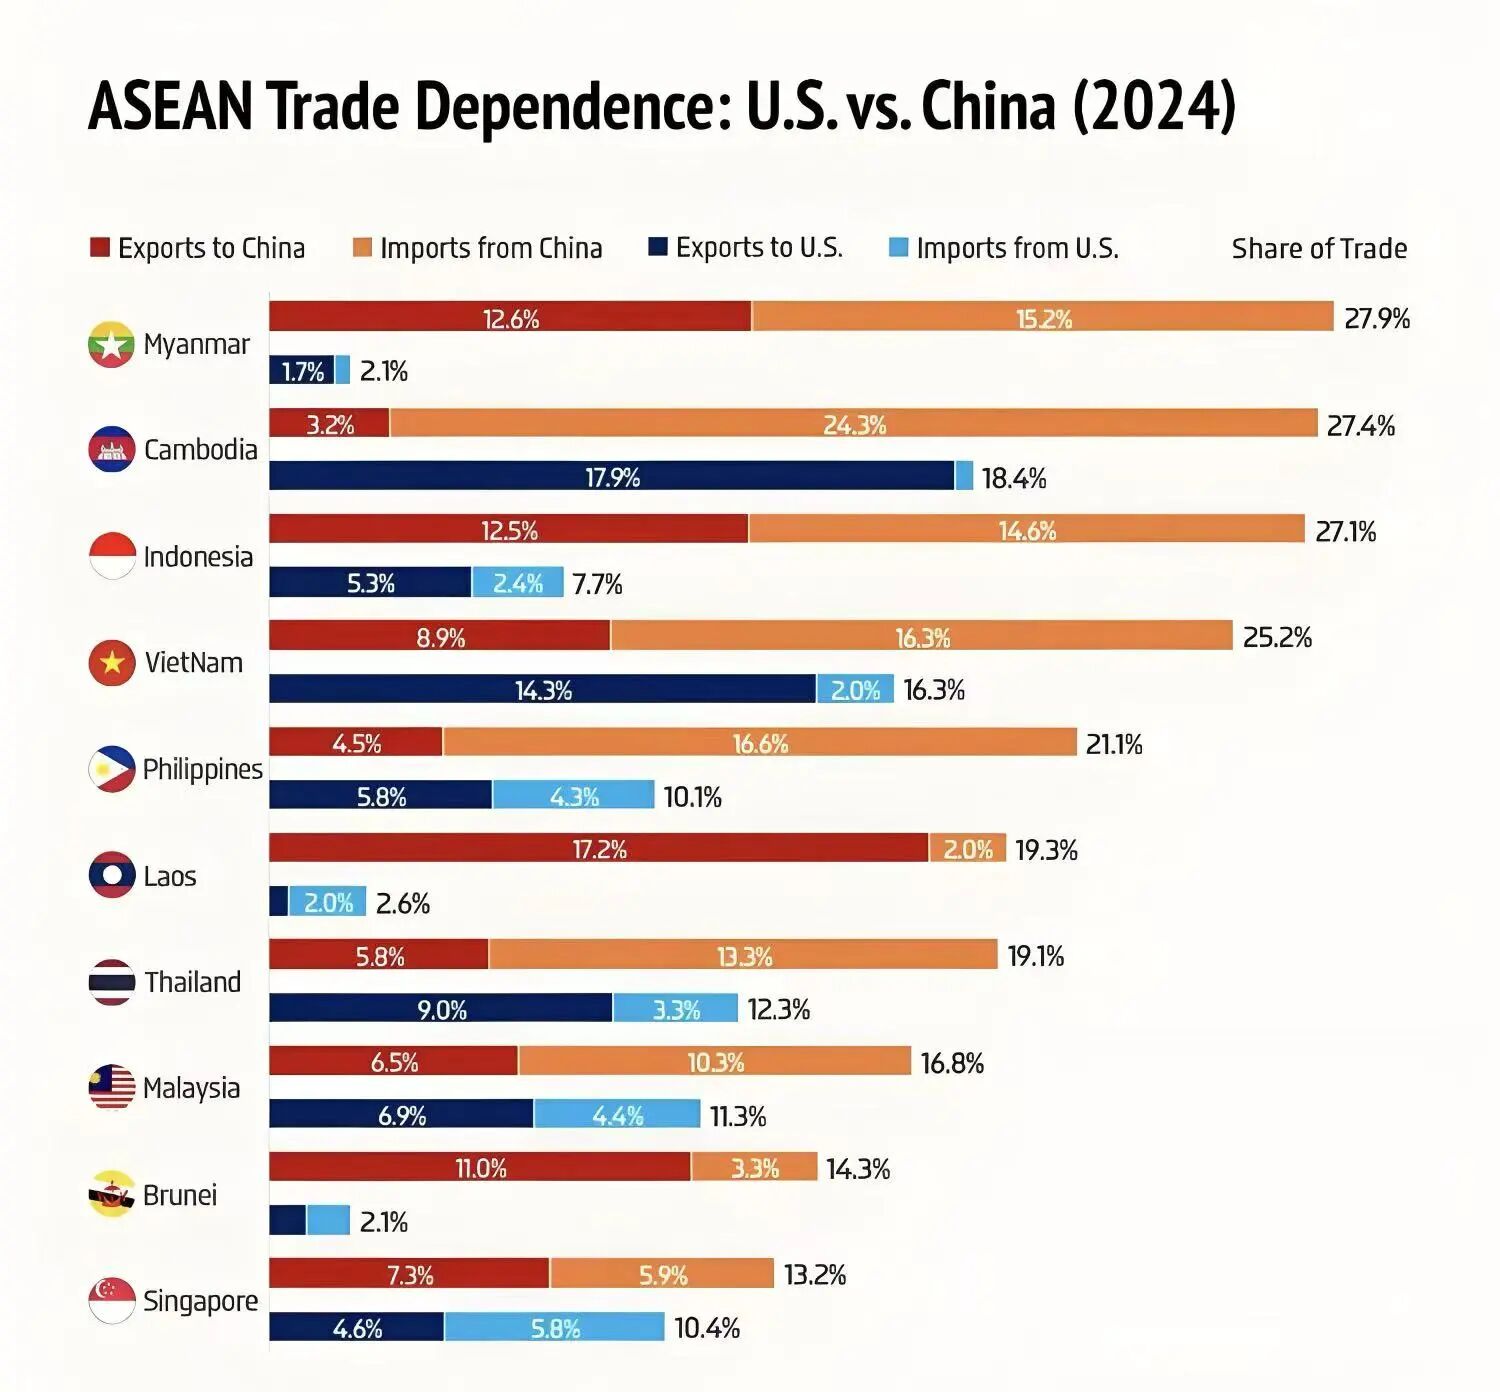
Most Southeast Asian countries have become beneficiaries of the US-China rivalry, with their basic trade model involving importing intermediate goods from China and exporting finished products to the US.
I. Overall

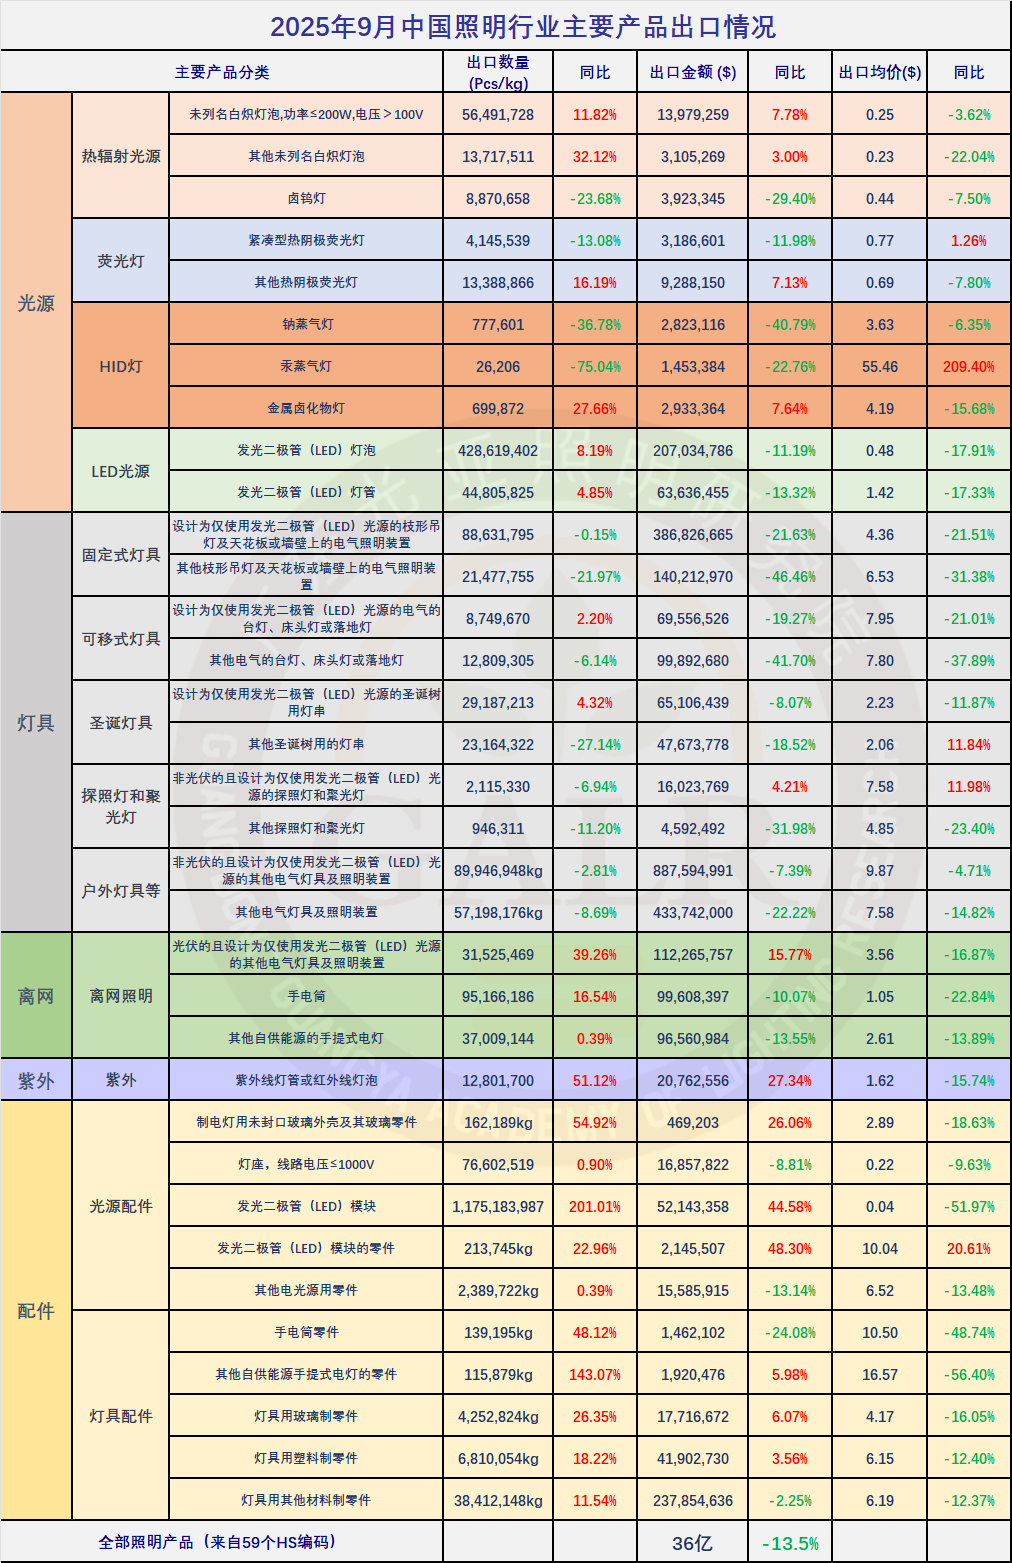
Export of Major Lighting Products in September 2025
(Click to view larger image)
September 2025
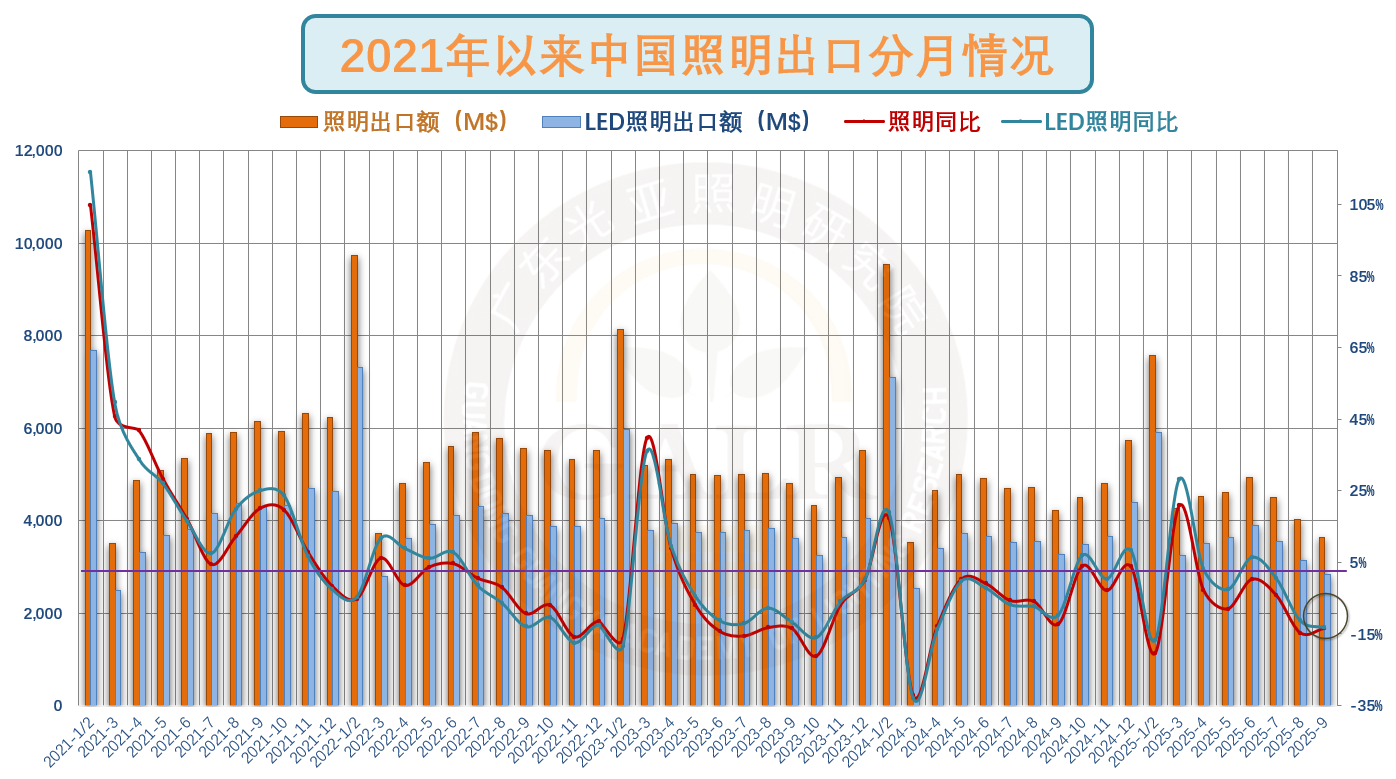
Single-month export value was USD 3.6 billion, the lowest in 17 consecutive months since March 2024, down 13.5% Year-on-year (YoY), compared to the previous value of -14.8%, with a slight narrowing in the decline; Month-on-month, it decreased by 9.3%, compared to the previous value of -10.8%. Among them, LED lighting products amounted to USD 2.8 billion, down 13.3% Year-on-year (YoY).
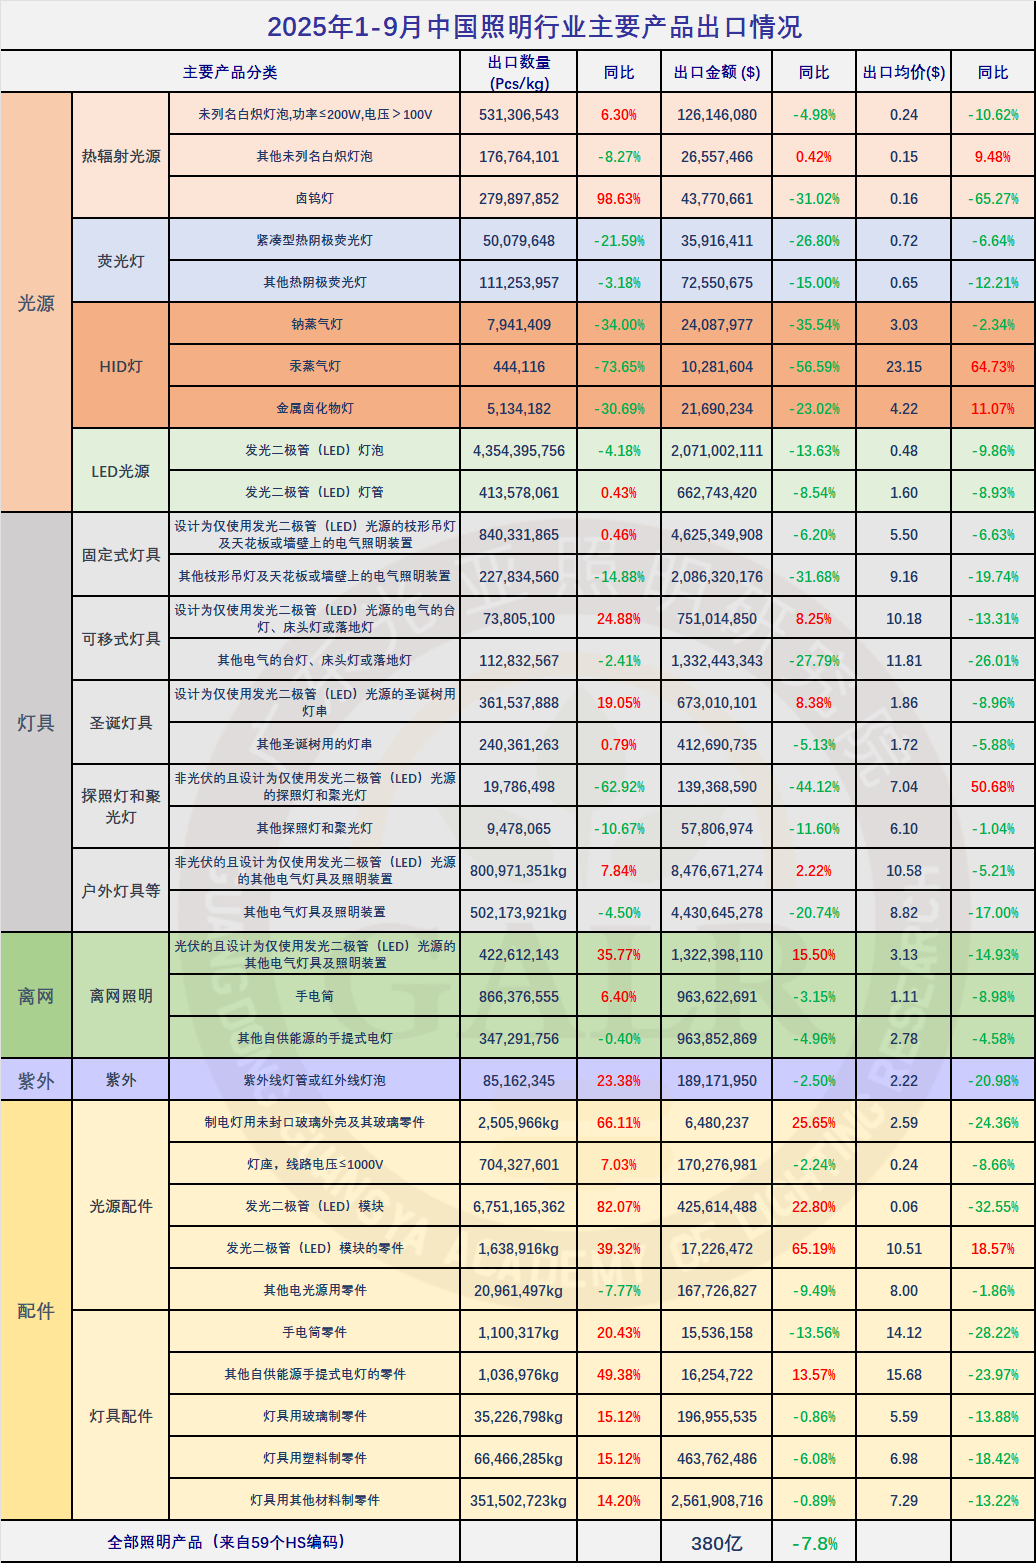
Export of major lighting products from January to September 2025
(Click to view large image)
First three quarters of 2025
Total Export value of Chinese lighting products was USD 38 billion, down 7.8% Year-on-year (YoY), with the decline widening by 0.7 percentage points compared to January-August, and the growth rate for the same period last year was -5.0%. Among them, the Export value of LED lighting products was USD 29.7 billion, down 3.4% Year-on-year (YoY), with the growth rate for the same period last year being -5.1%, accounting for 78.1% of the total Export value, an increase of 3.5 percentage points compared to the same period last year.
(Click to view large image)
Monthly Export
Monthly Breakdown
In January and February 2025, the start of the year saw the largest decline in export value since March 2024, driven by a high base from the same period last year, disruptions from the shifted timing of the Spring Festival, and the phased end of the pre-inauguration "rush to export" before Trump took office as president. By March, earlier disruptive factors had dissipated, supply-side bottlenecks gradually eased, tariff impacts had not yet materialized, and the low base effect from the same period last year contributed to a rebound in the data.
Starting in the second quarter, the disruptive impact of US reciprocal tariffs on exports began to gradually manifest, with declines recorded in both April and May; the decline narrowed in June due to a phased easing of the China-US tariff dispute; July saw another decline as the effects of the rush to export and re-export weakened; and in August and September, the decline widened under the influence of base effects, tariff policies, and the appreciation of the renminbi.
Quarterly Export
(Click to view large image)
By quarter
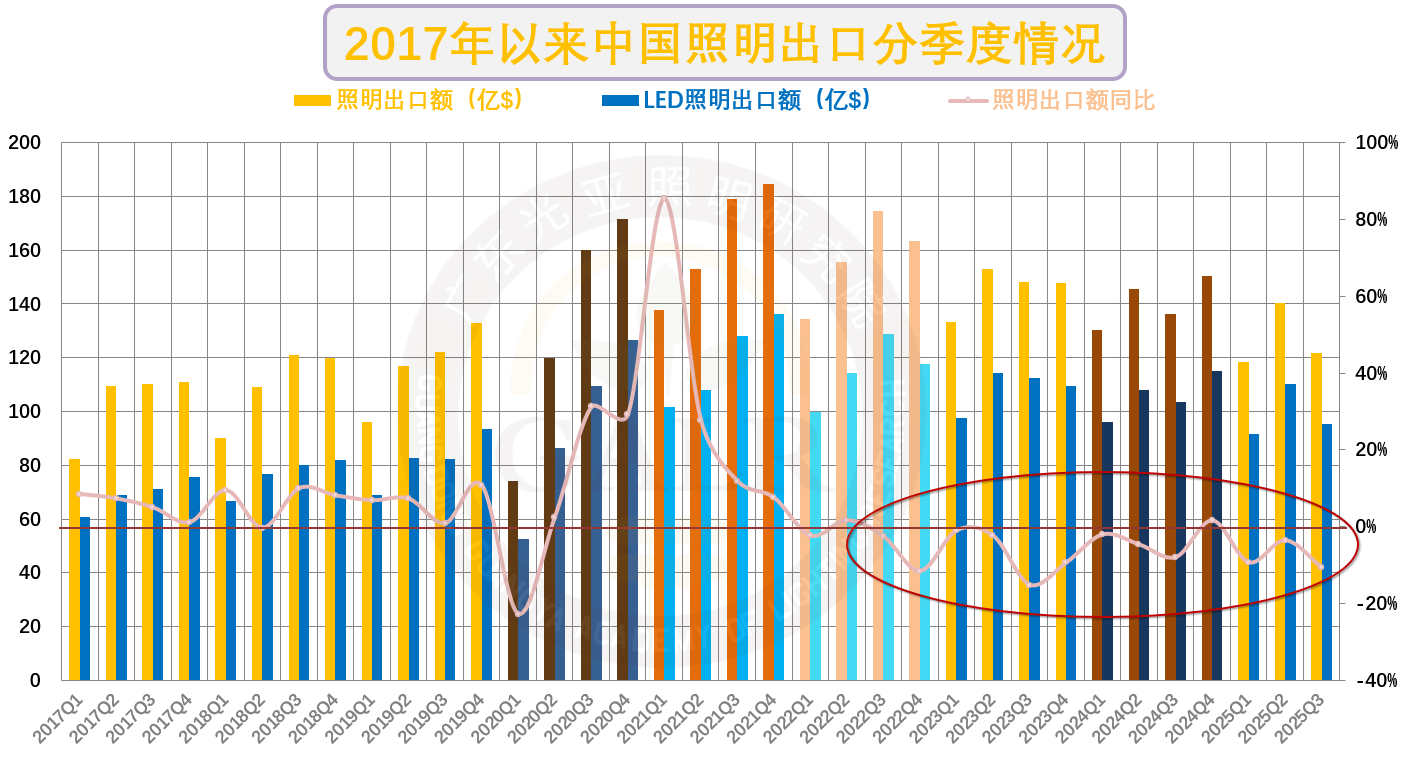
In 2024, the first quarter recorded a narrowing decline driven by performance in January and February, remaining basically flat with a slight decrease compared to the same period last year, with a slight Year-on-year (YoY) declineof 2.0%; in the second quarter, without the interference of comparison bases from the significant fluctuations in the same period of 2023 and under the influence of seasonal cycles, it also avoided a sharp decline, declining by only4.7%; in the third quarter, the decline deepened to8.0% against the low base of the previous year, while in the fourth quarter, as interfering factors subsided and aided by the low comparison base and the pre-year "rush to Export", it turned positive to1.6%.
Entering the first quarter of 2025, the rebound in March alone could not offset the impact of the sharp decline in January and February, recording-9.3%, and in the second quarter, dragged down by the USIEEPAtariffs叠加 reciprocal tariffs, it declined by3.6%. In the third quarter, the weakening effect of rushing exports and re-exports led to an expanded decline.
Thus, among the 15 quarters since 2022, only Q2 2022 and Q4 2024 saw slight positive growth, while all other quarters experienced negative growth.
II. Reasons
1. Weak demand
Technical growth constraints
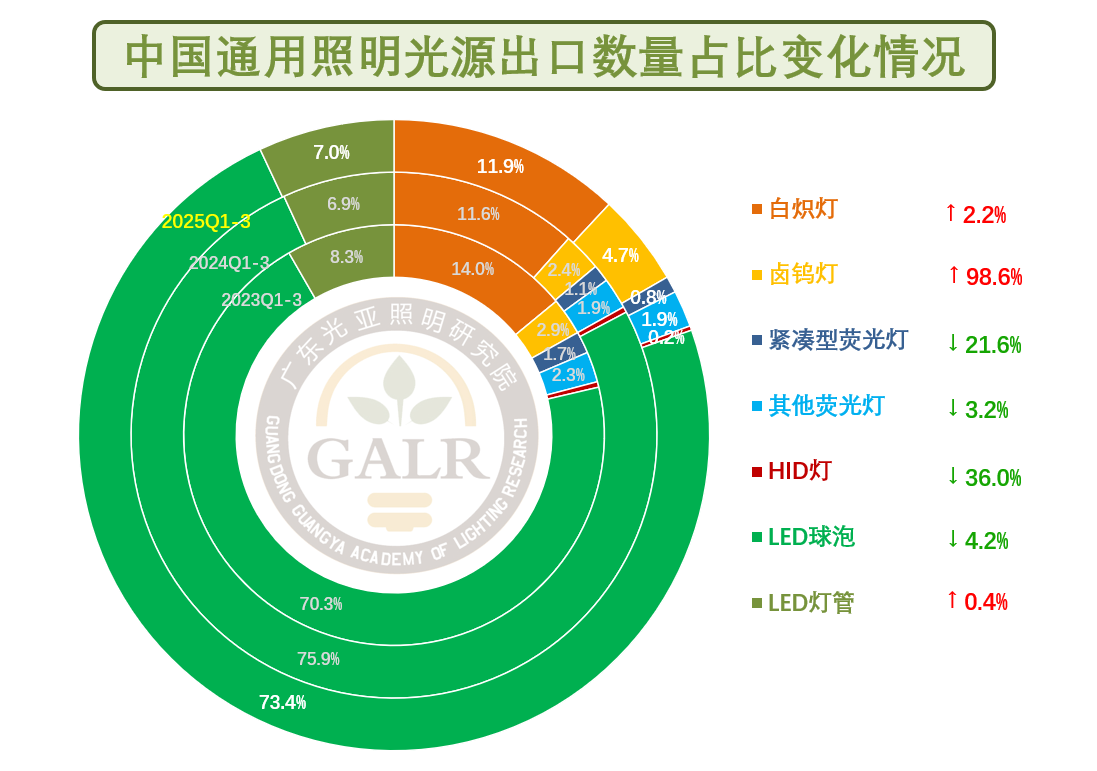
LED light sources already account for over 80%. Without the unsustainable surge in tungsten halogen lamp volumes from Vietnam and Cambodia, the share of LED light sources would exceed 85%.
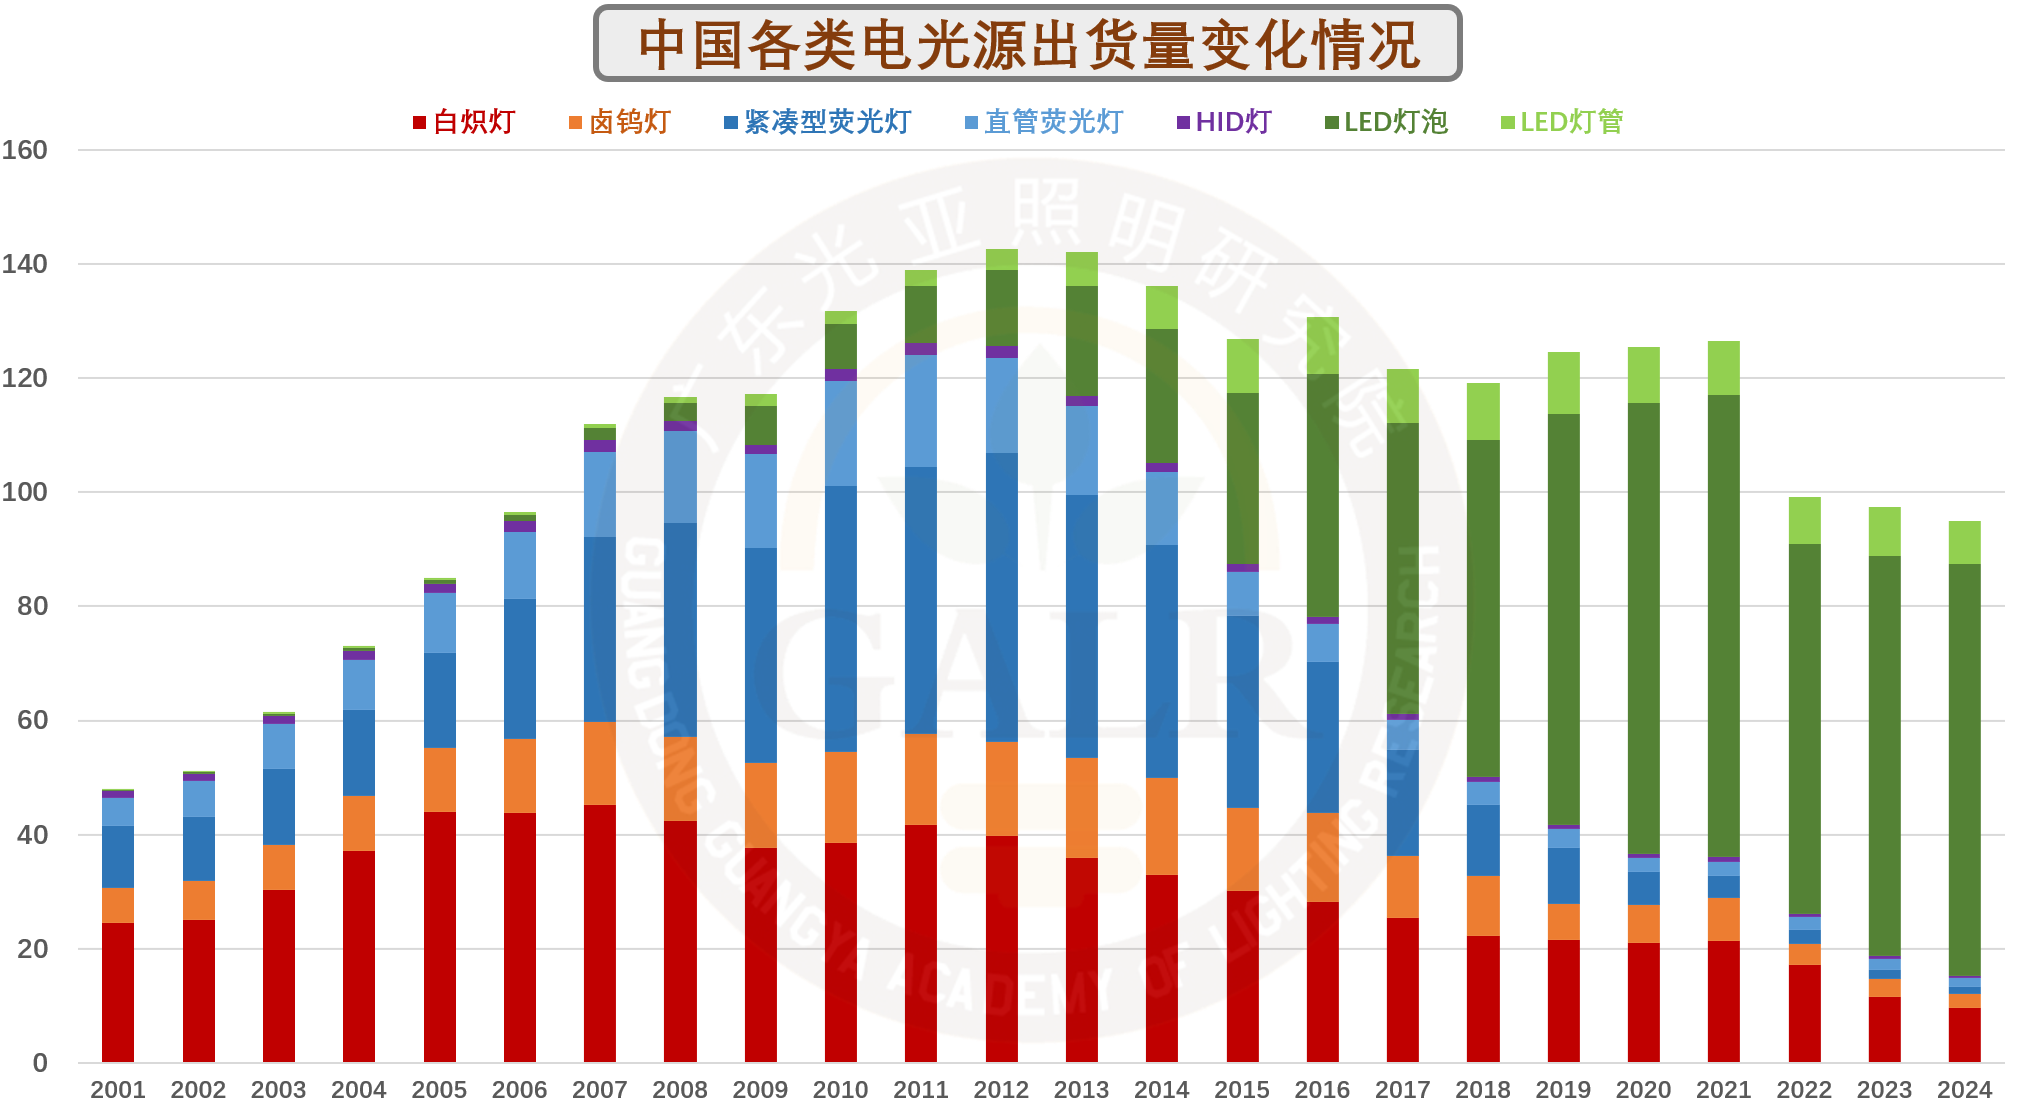
From the current product structure of light sources, this trade-off further compresses the replacement space.
Market growth bottleneck
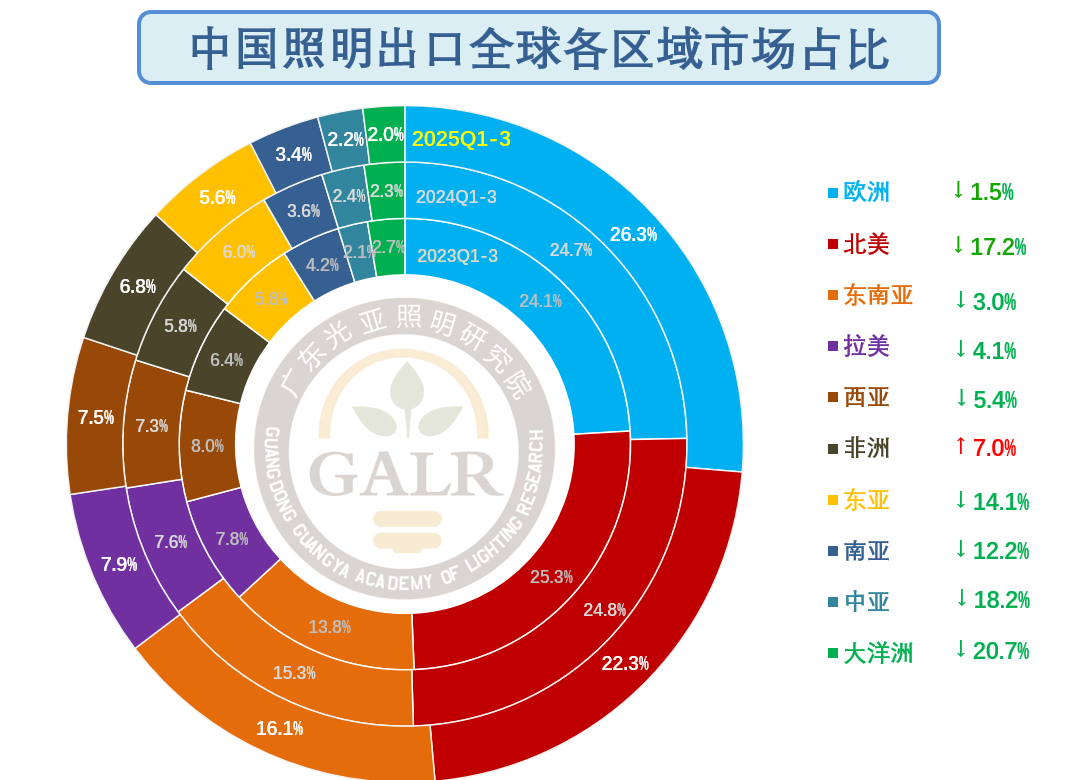
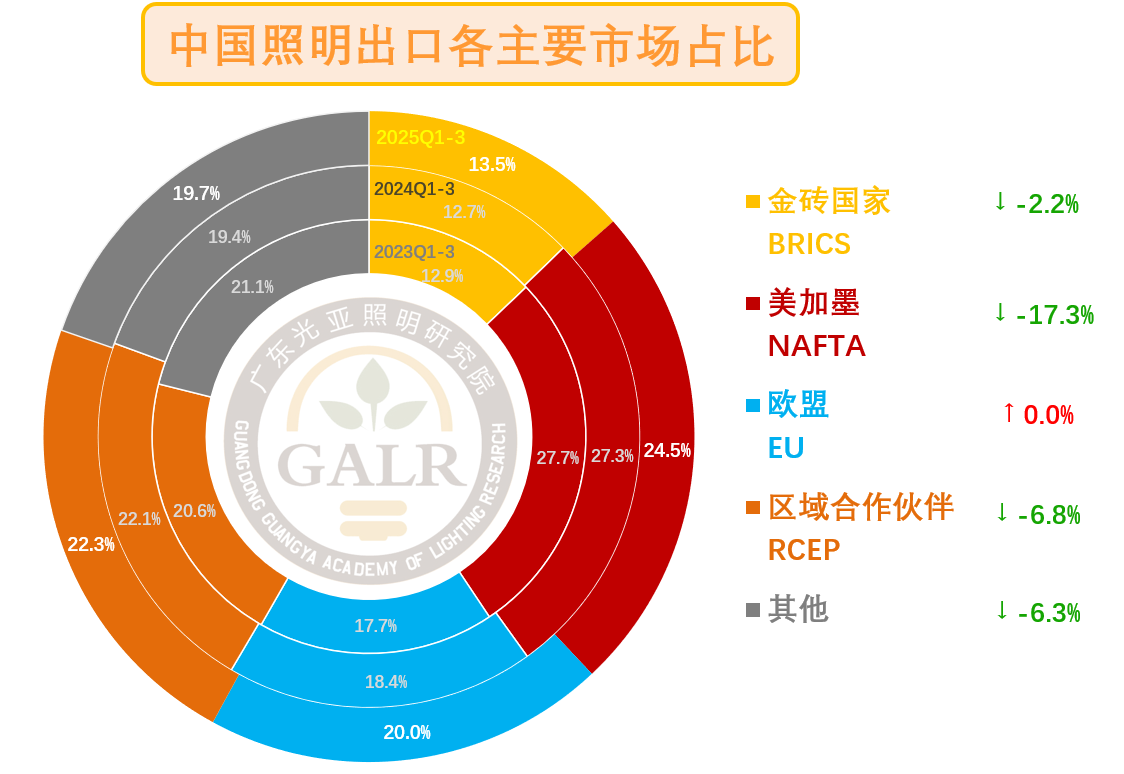
The performance of regional markets across various thematic concepts was also lackluster, with only the EU remaining flat.
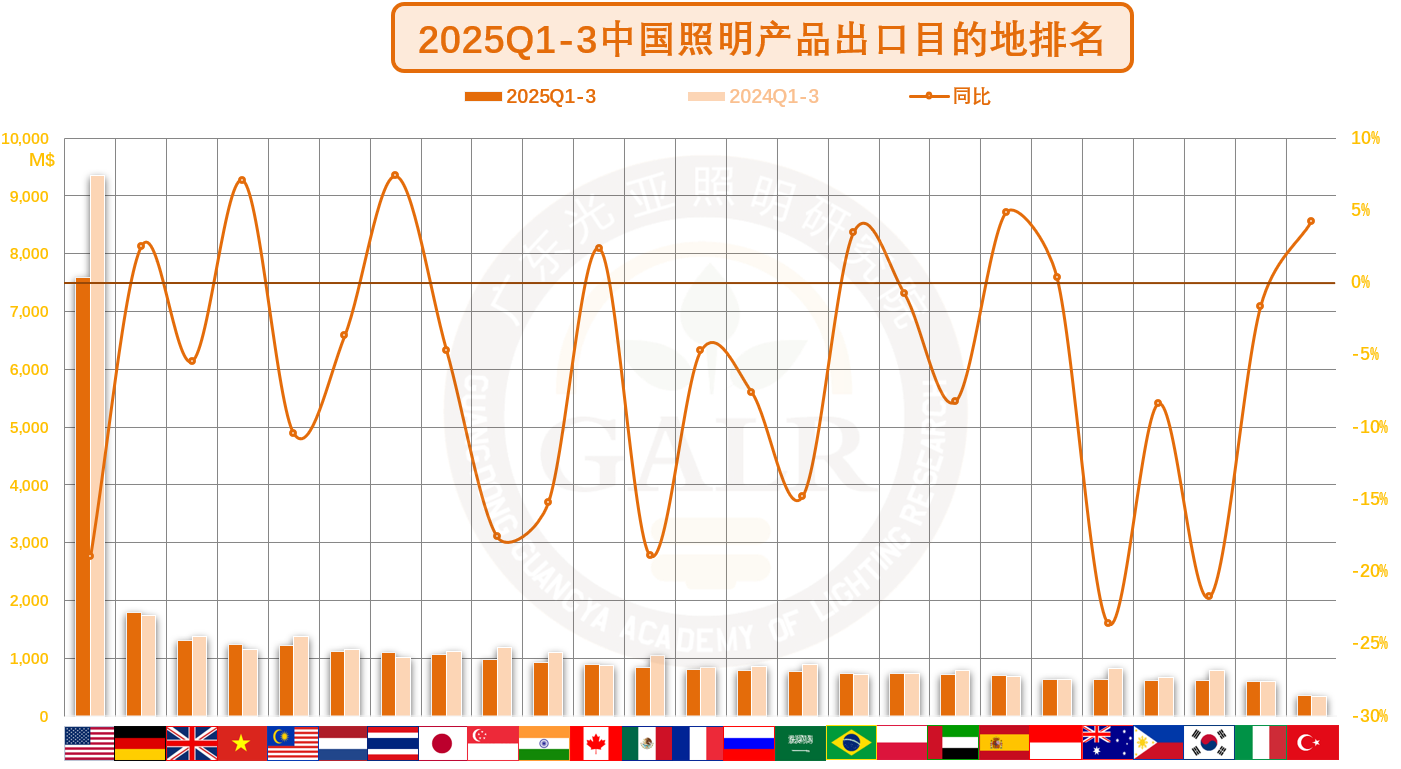
Among the top single markets, more than two-thirds declined.
2. Production capacity spillover
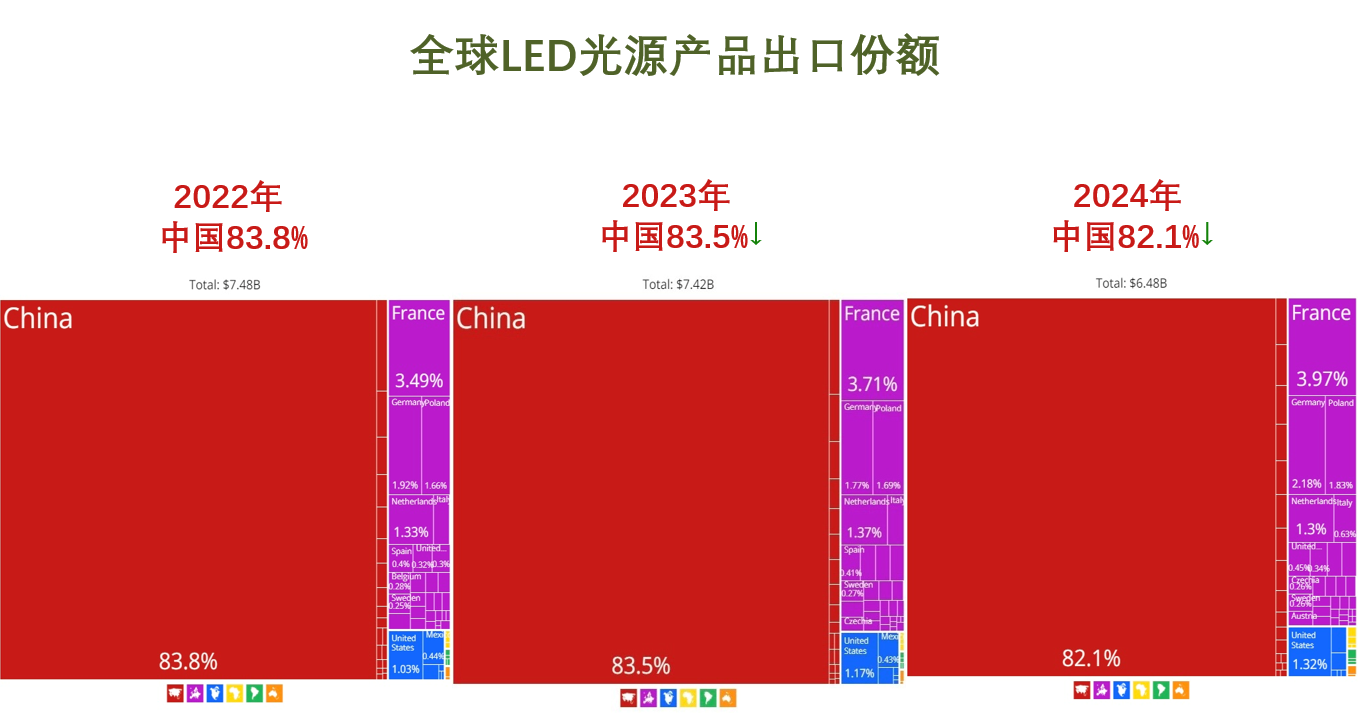
Compared to luminaire products, China's position as a manufacturing center for LED light source products remains relatively stable. The decrease in share is mainly influenced by large emerging economies currently pursuing "localization of manufacturing" and "localization of production capacity".
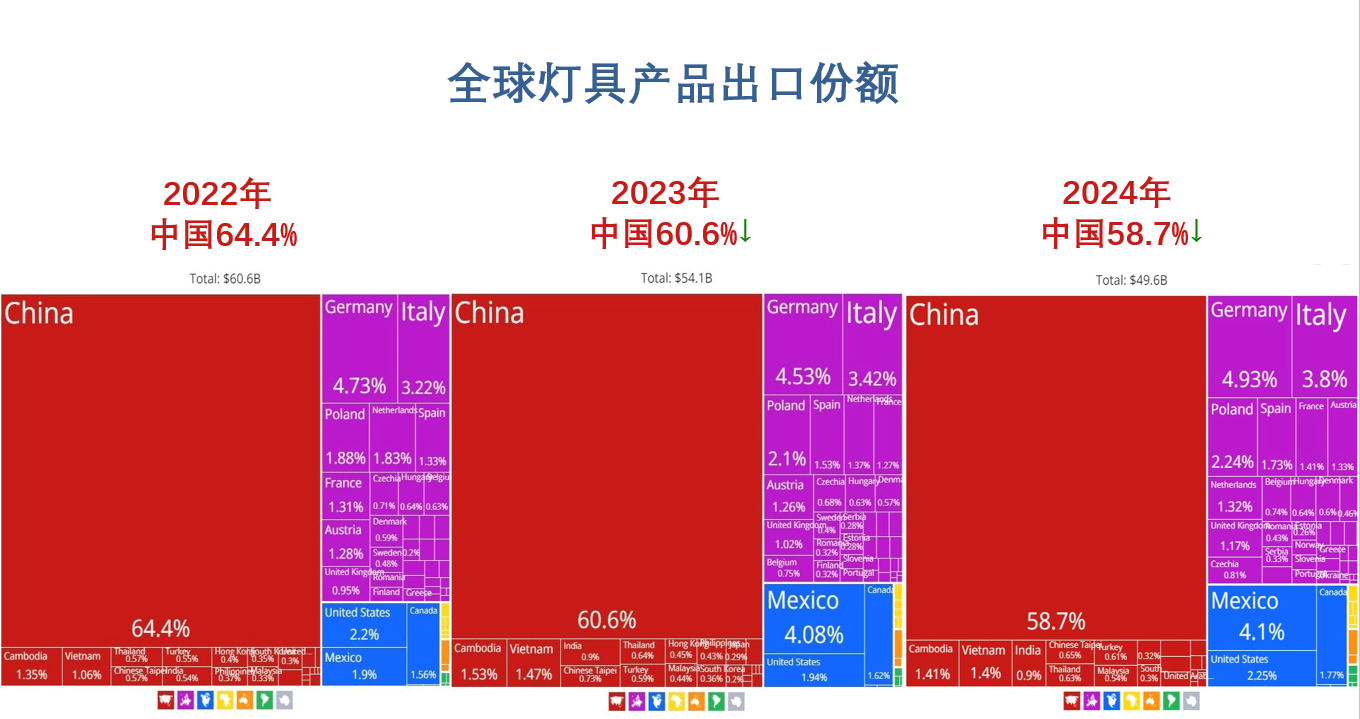
Luminaires are mainly affected by the partial spillover of production capacity and supply chains caused by the global industry chain restructuring centered on "friend-shoring" and "nearshoring", aggressively promoted by Europe and the US. In short, China's position as the global lighting manufacturing center is facing unprecedented challenges, and it needs to leverage its advantages as a supply chain hub more in the future.
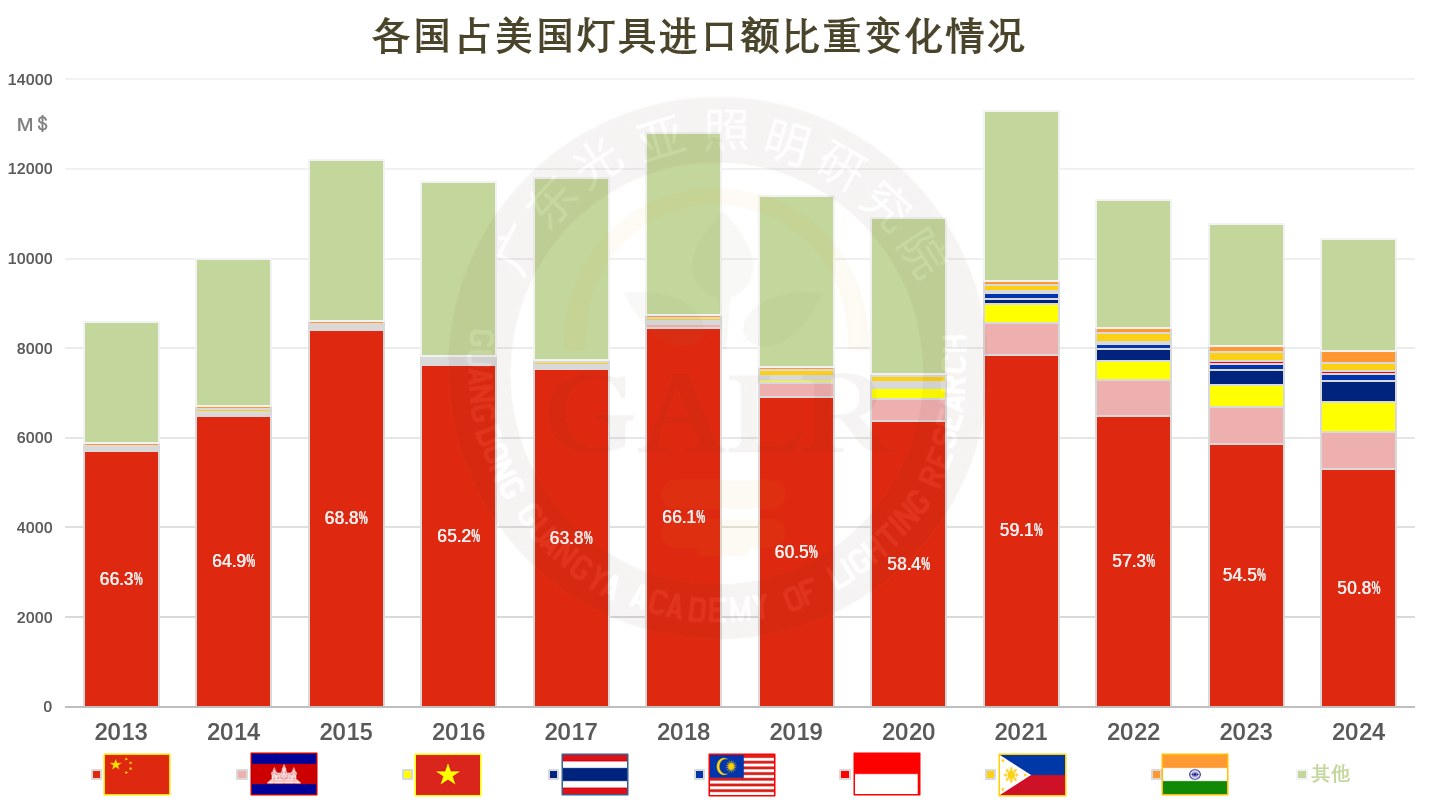
China's share of US luminaire imports has declined from nearly 70% at its peak before 2018 to 50%, while the share of Southeast Asia and India has risen from less than 2% to over 20%.
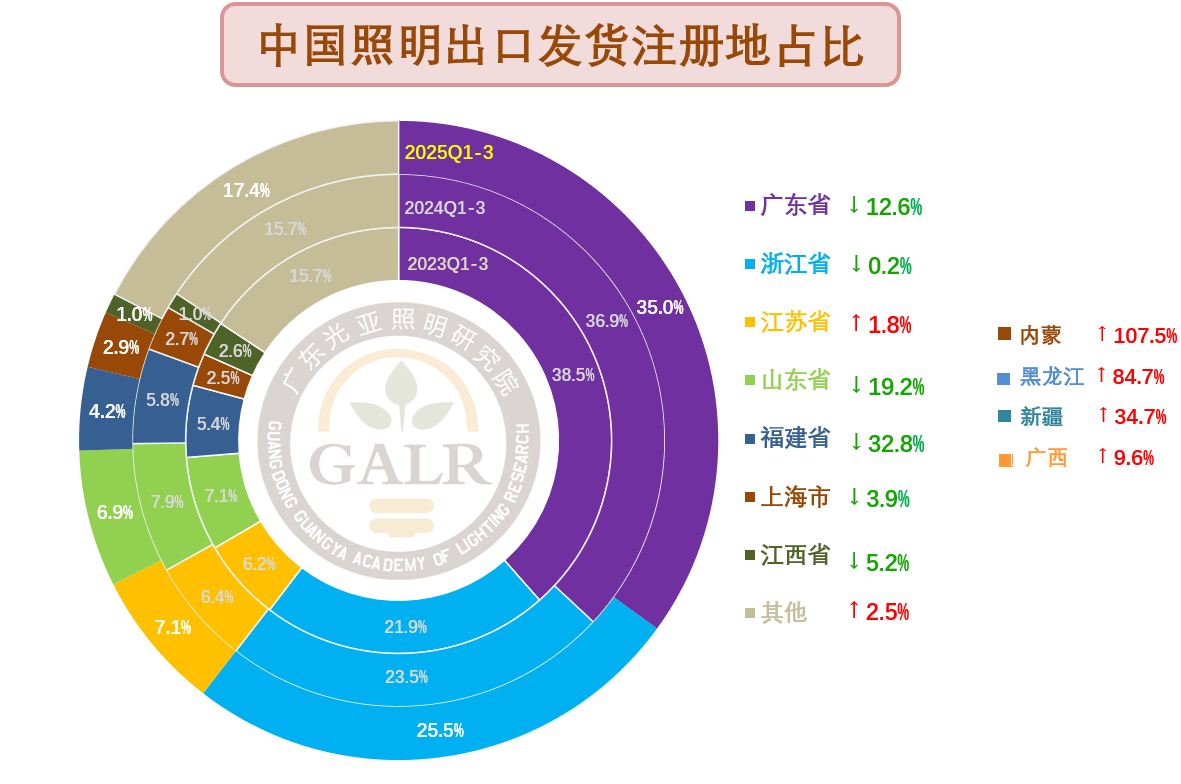
Guangdong and Fujian, which are significantly affected by the spillover of production capacity, show a substantial decline in their 2025 data.
3. Increased Tariffs
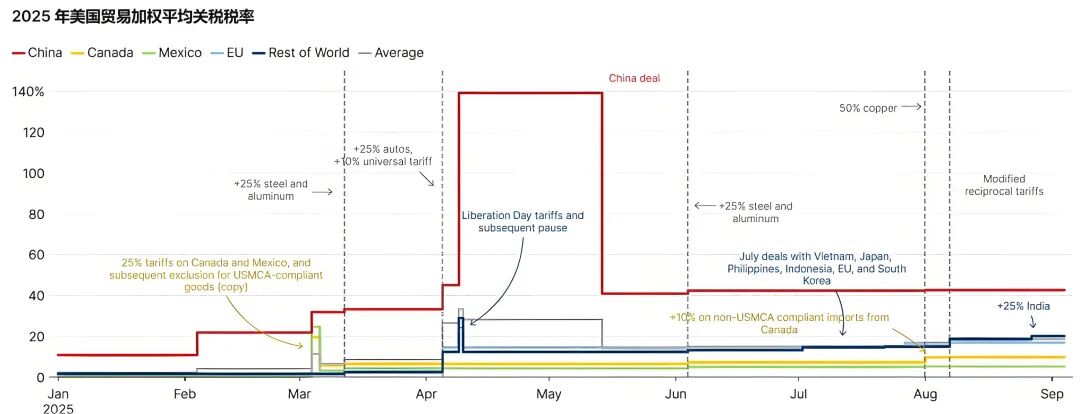
Following Trump's second term, US tariff levels have continued to rise, with the weighted tariff level on China being the highest globally.
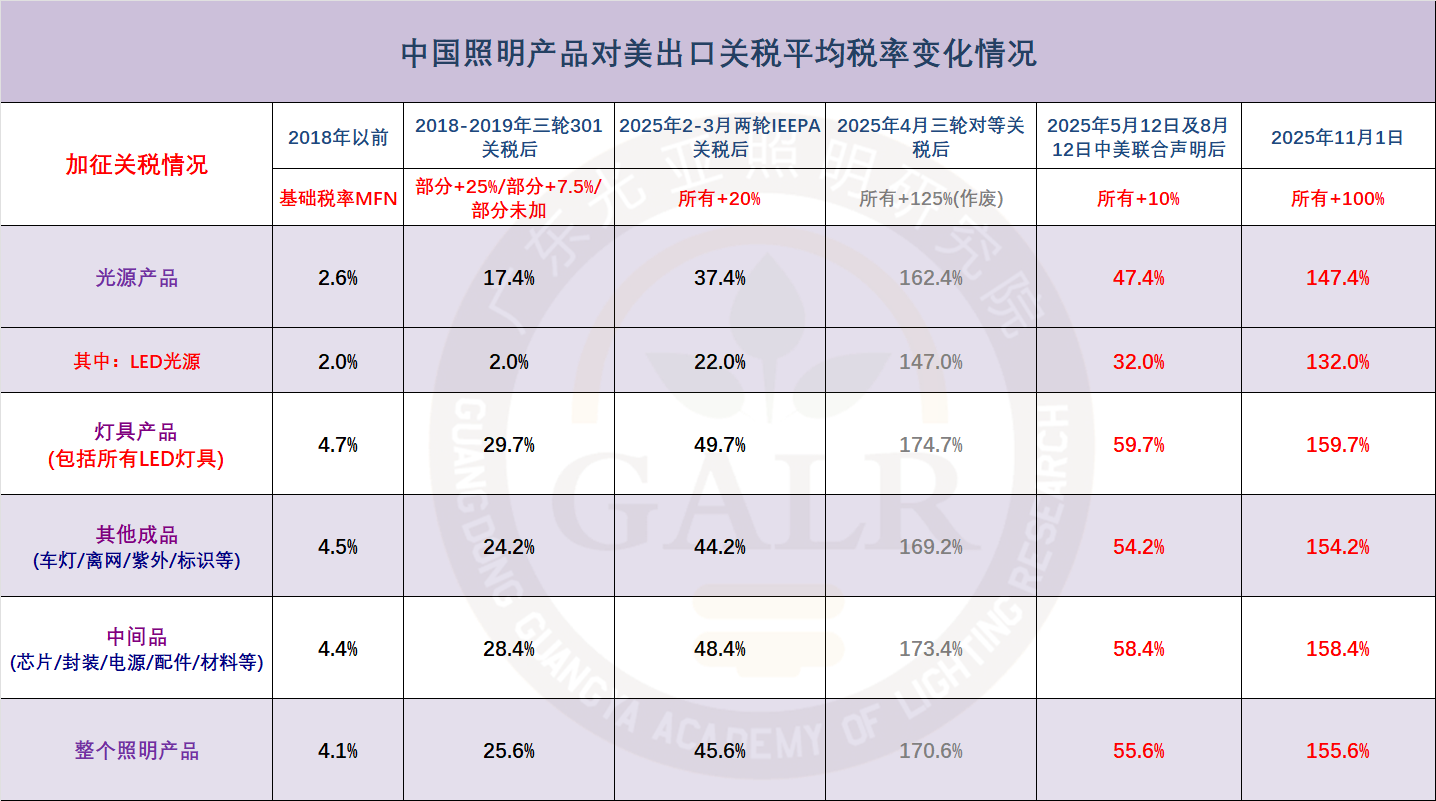
Starting November 1, 2025, the average tariff on Chinese lighting product exports to the US will reach as high as 155.6%.
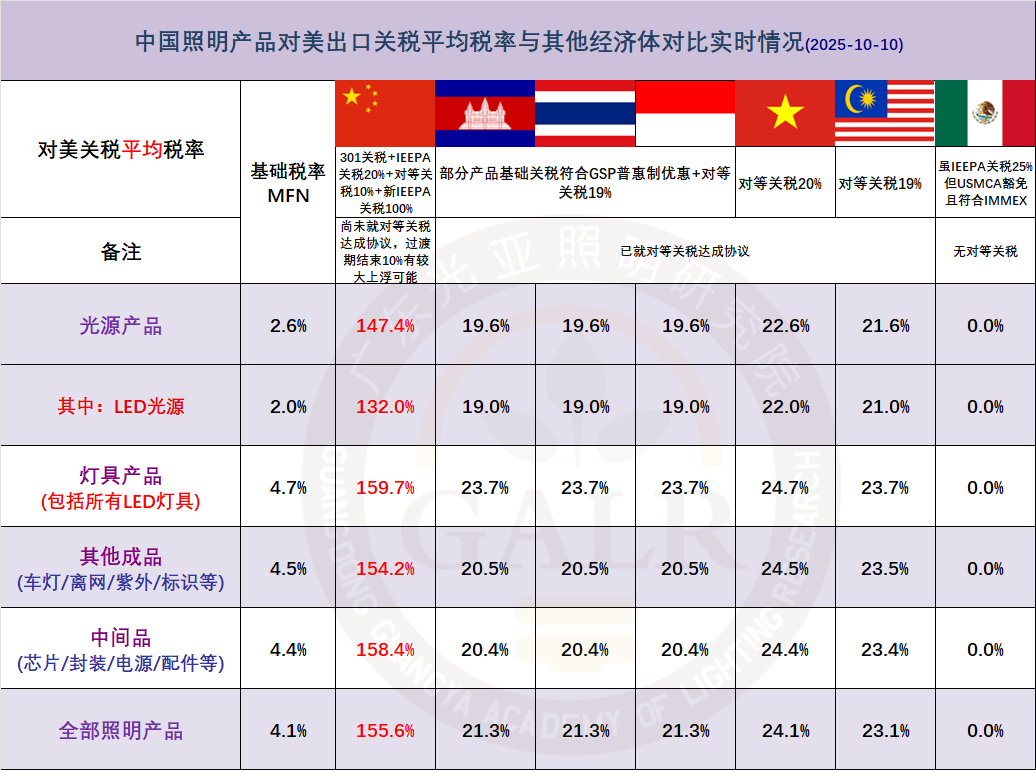
Compared with other major economies where production capacity has shifted, Chinese lighting products face abnormally high US tariffs: LED light sources are at least 110% higher, and LED luminaires are at least 135% higher.
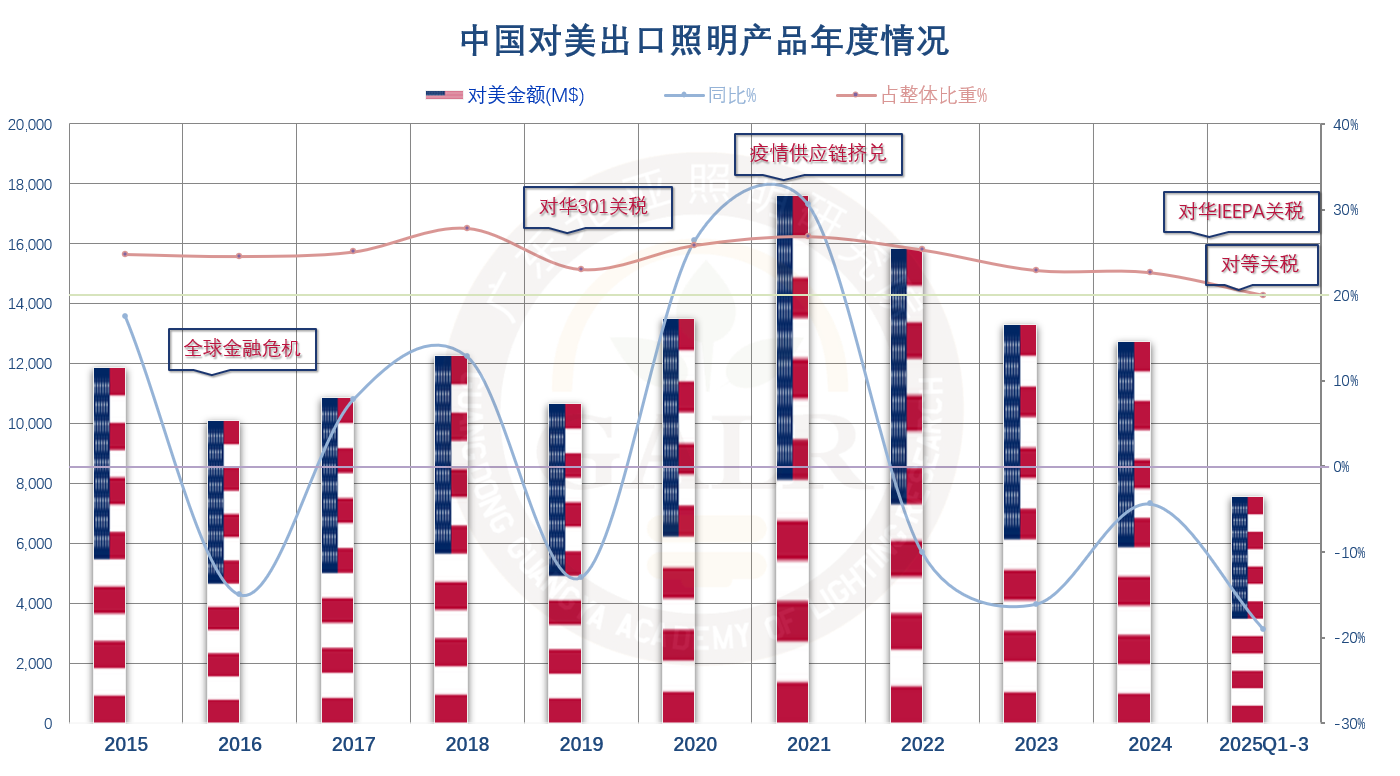
导致2025年前三季度,中国照明产品对美出口同比下滑19%,为大盘最大拖累,占总额比重历史上首次跌破20%大关。
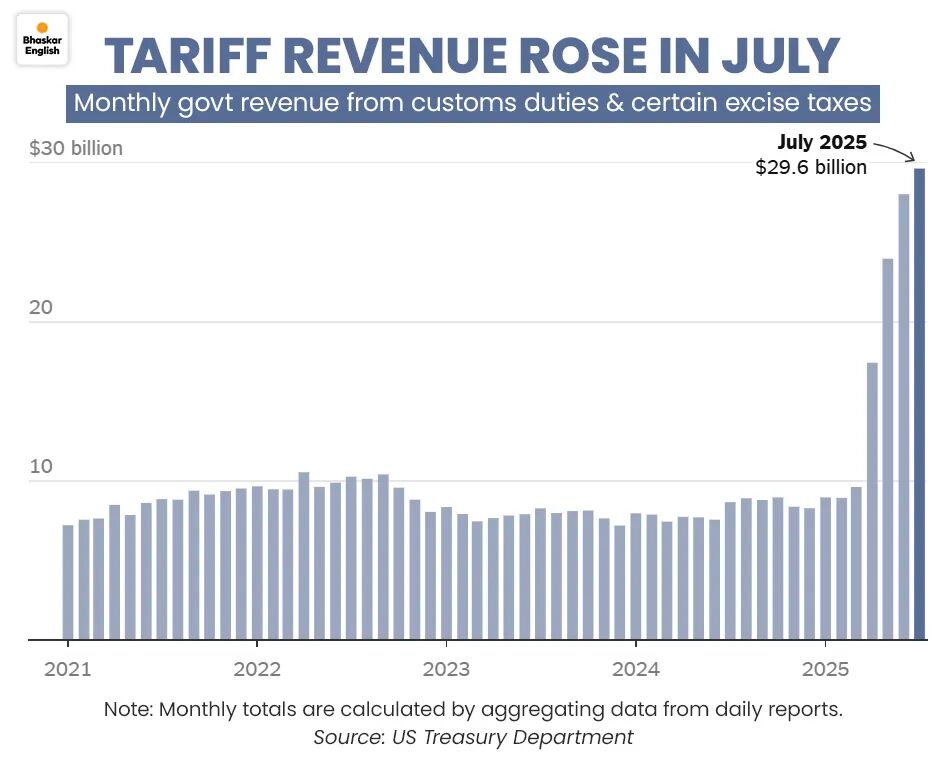
Since the release of reciprocal tariffs in April 2025, US tariff revenue has increased significantly.
4. Price deflation
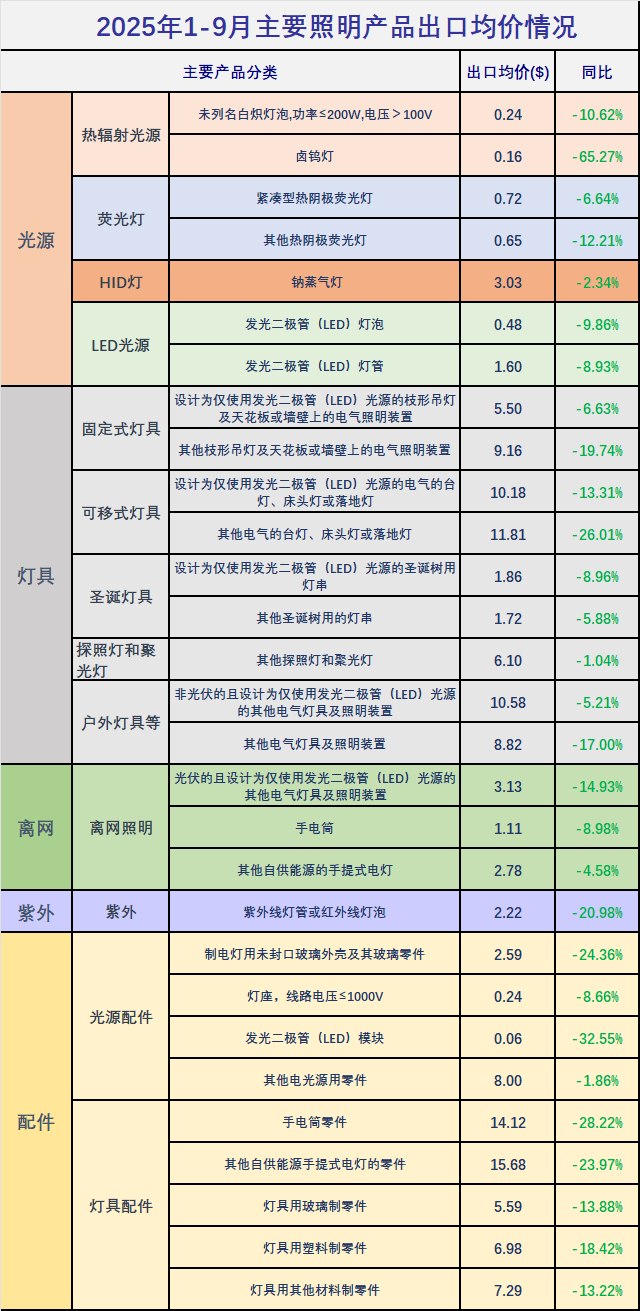
In the first three quarters of 2025, the average export price of most products continued to decline. Structural overcapacity on the supply side led more companies to trade price for volume, merely surviving while intensifying internal competition.
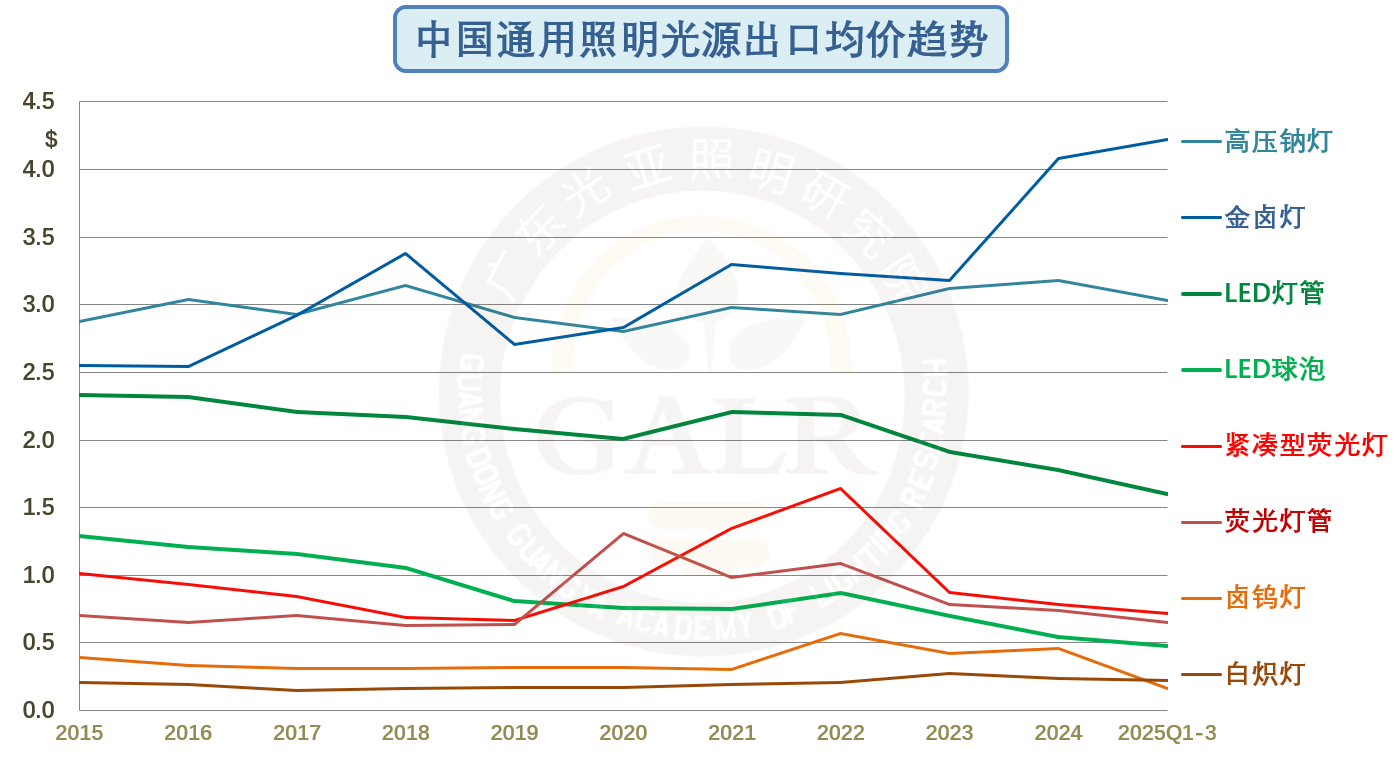
The downward trend in the average export price of LED products is obvious and difficult to reverse. Supply-demand imbalance is a major driver of price competition, and the biggest issue for the industry this year is unprecedented pressure on profits.
One consequence of the "rise in the East, decline in the West" in foreign trade markets is that part of the high-value market share in Europe and America has been replaced by low-value emerging markets, affecting the total value of goods.
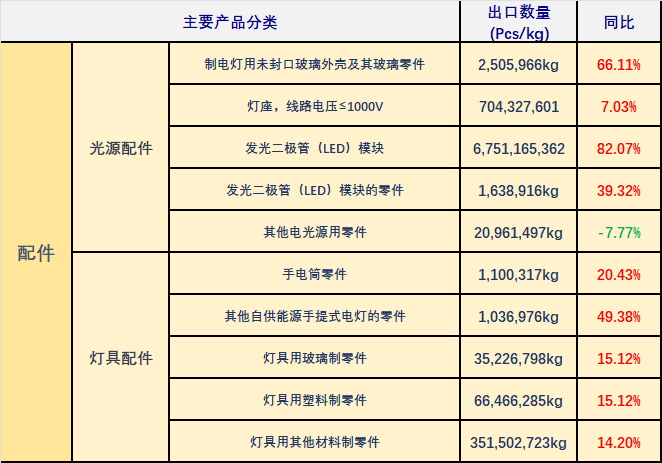
The growth rate of intermediate goods significantly outperformed the overall market and finished goods, which correspondingly lowered the total amount.
3. Outlook
(Click to view large image)
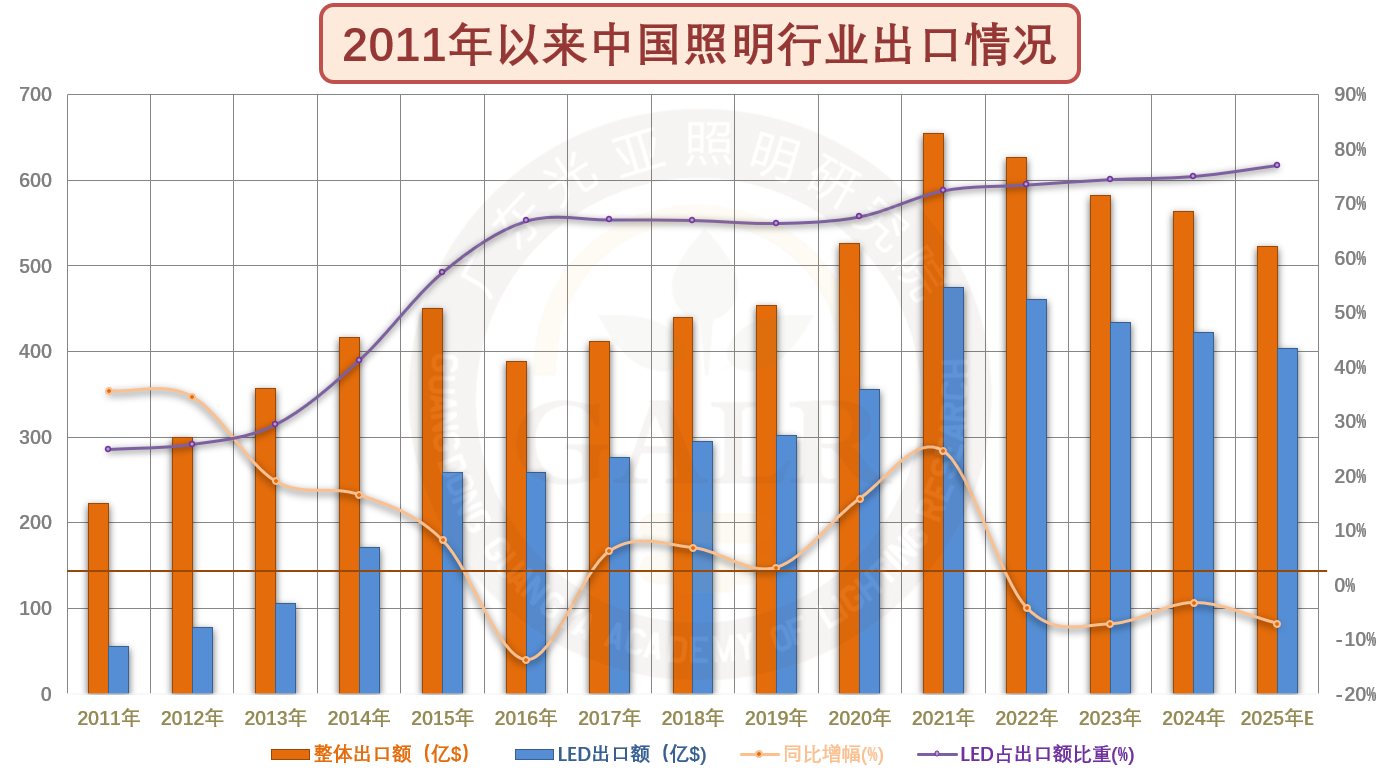
China's lighting Export scale has shrunk for three consecutive years since its peak in 2021, and the downward trend will continue in 2025.
(Click to view large image)
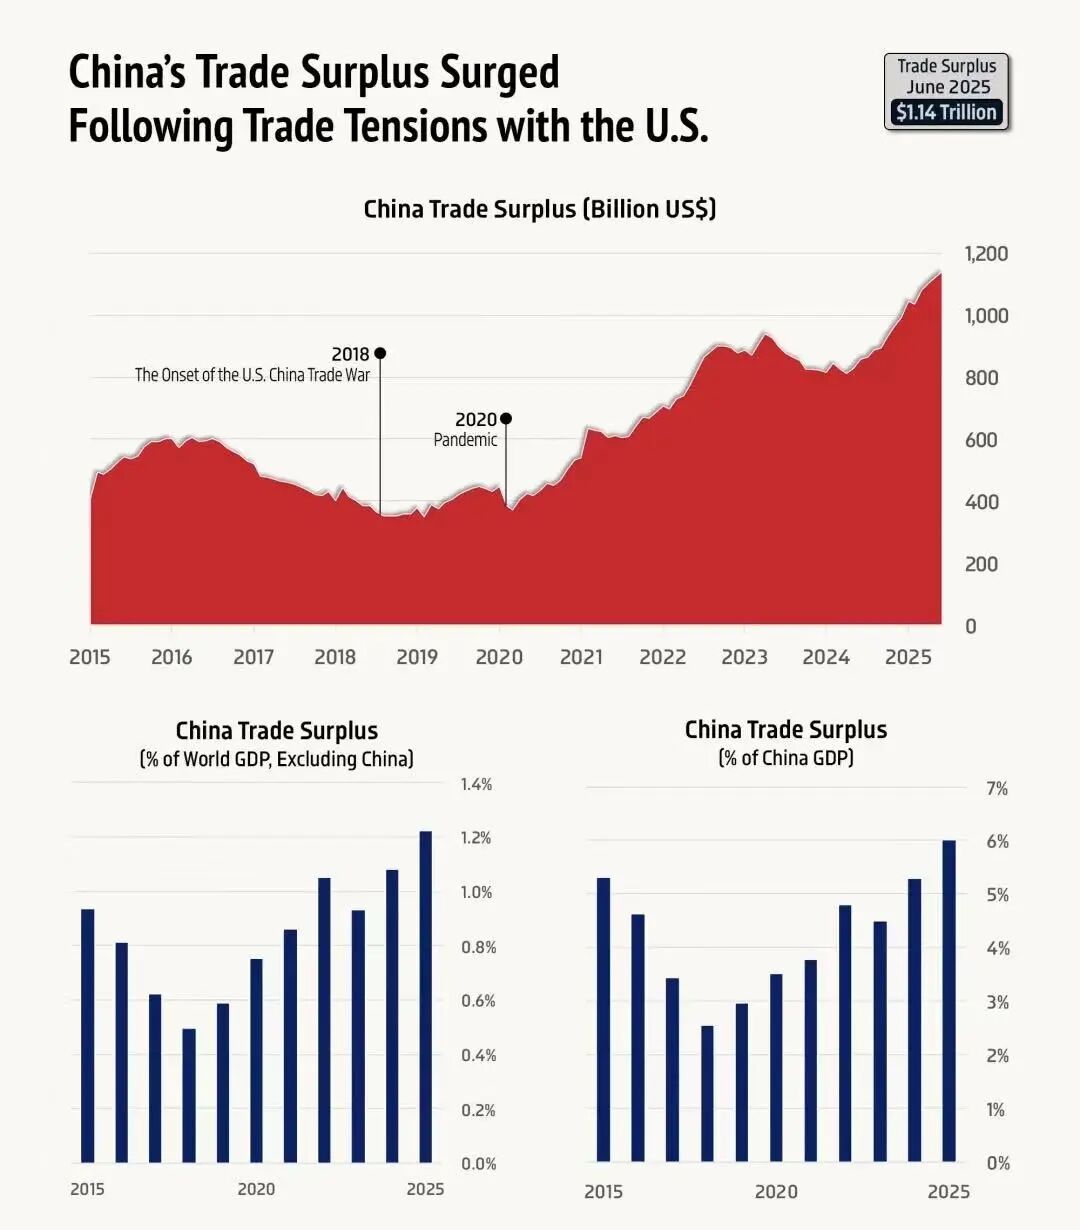
During the China-US trade friction, China's trade surplus increased instead of decreasing, which will invite more pressure.
The above article is sourced from Guangya Lighting Research Institute, author Wen Qidong