
Shocking! China's lighting industry exports showed this trend in the first half of 2025...
According to statistics from the General Administration of Customs, in June 2025, the total value of China's import and export of goods was 3.85 trillion yuan, a year-on-year increase of 5.2%, ranking as the second highest monthly level in history; the total export value was 2.34 trillion yuan, a year-on-year increase of 7.2%. In US dollars, the total import and export value was 535.6 billion USD, a year-on-year increase of 1.1%; the total export value was 325.2 billion USD, a year-on-year increase of 5.8%. Certain progress was made in the Geneva and London economic and trade talks between China and the United States, prompting a certain correction in trade between the two countries. In June, exports to the US decreased by 16.1% year-on-year, with the decline narrowing significantly by 18.4 percentage points compared to May.

In the first half of 2025, the total value of China's import and export of goodswas 21.79 trillion yuan, a year-on-yearincrease of 2.9%, withthe second quarter marking the ninth consecutive quarter exceeding 10 trillion yuan; the total export value was 13 trillion yuan, a year-on-year increase of 7.2%. In US dollars, the total import and export value was3.03 trillion USD, a year-on-yearincrease of 1.8%; among which the total export valuewas 1.81 trillion USD, a year-on-yearincrease of 5.9%.
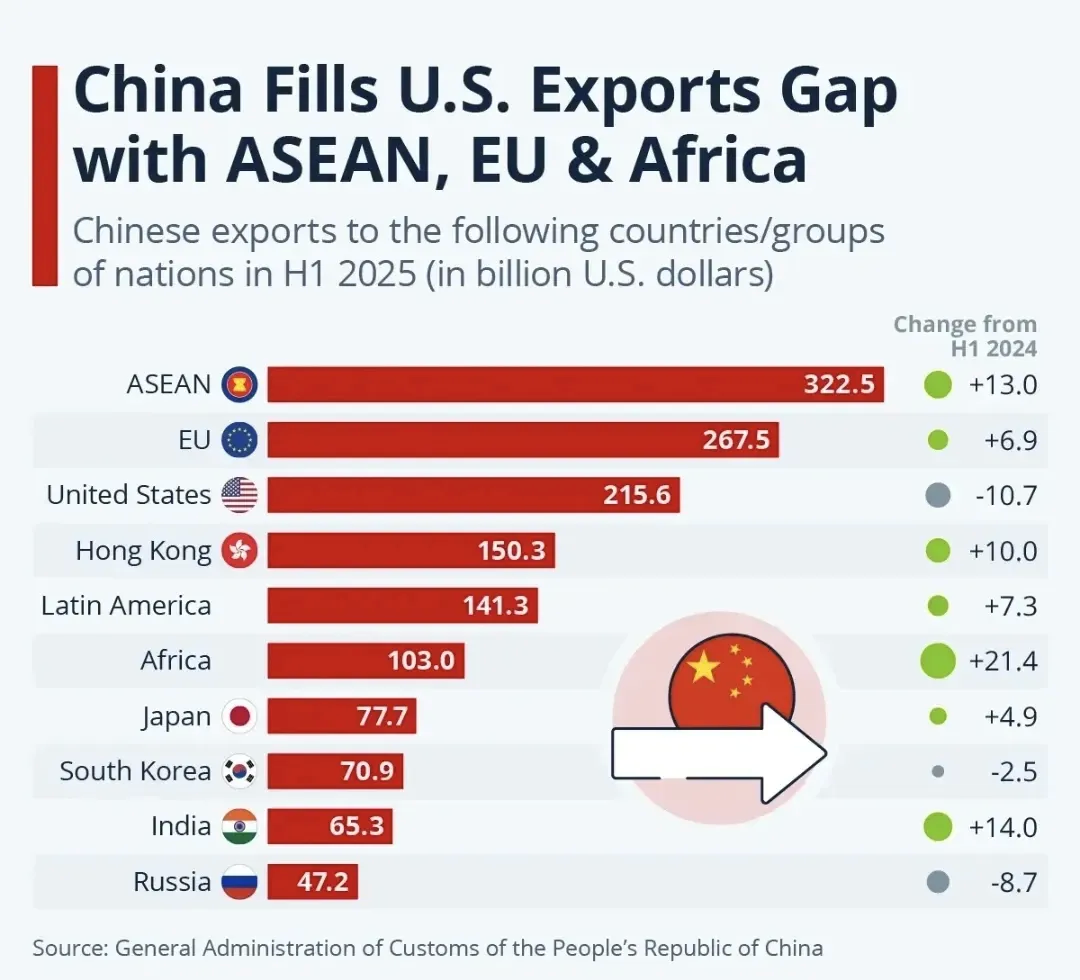
On one hand, the export of mechanical and electrical products in the first half of the yearreached 7.7 trillion yuan, accounting for nearly60%of total exports, a year-on-yearincrease of 9.5%, still outperforming the overall export market. On the other hand, exports to the US were negatively affected by tariffs, declining by 10.7%, becoming a drag on the overall market. In addition, exports to ASEAN, the largest trading partner, increased by 13.0% year-on-year, and exports to the EU, the second largest trading partner, increased by 6.9% year-on-year. In the first half of 2025, emerging markets contributed more to the growth, with imports and exports to Africareaching 1.18 trillion yuan, a year-on-yearincrease of 14.4%; imports and exports to Central Asiareached 357.2 billion yuan, a year-on-yearincrease of 13.8%; imports and exports to countries participating in the "Belt and Road" initiativereached 11.29 trillion yuan, a year-on-yearincrease of 4.7%, accounting for 51.8% of the total import and export value.

Looking ahead to the next phase, the various effects of "transit exports" and "rush exports" caused by the misalignment of the Spring Festival and tariffs in the first half of the year will further weaken, having to some extent overdrawn demand for the second half. On the other hand, the exemption from reciprocal tariffs imposed by the United States on China will expire on August 12, and the risk of tariff rate changes at that time will inevitably disrupt our country's exports. Fluctuations in the external environment remain a significant challenge for overall foreign trade in the second half of the year.
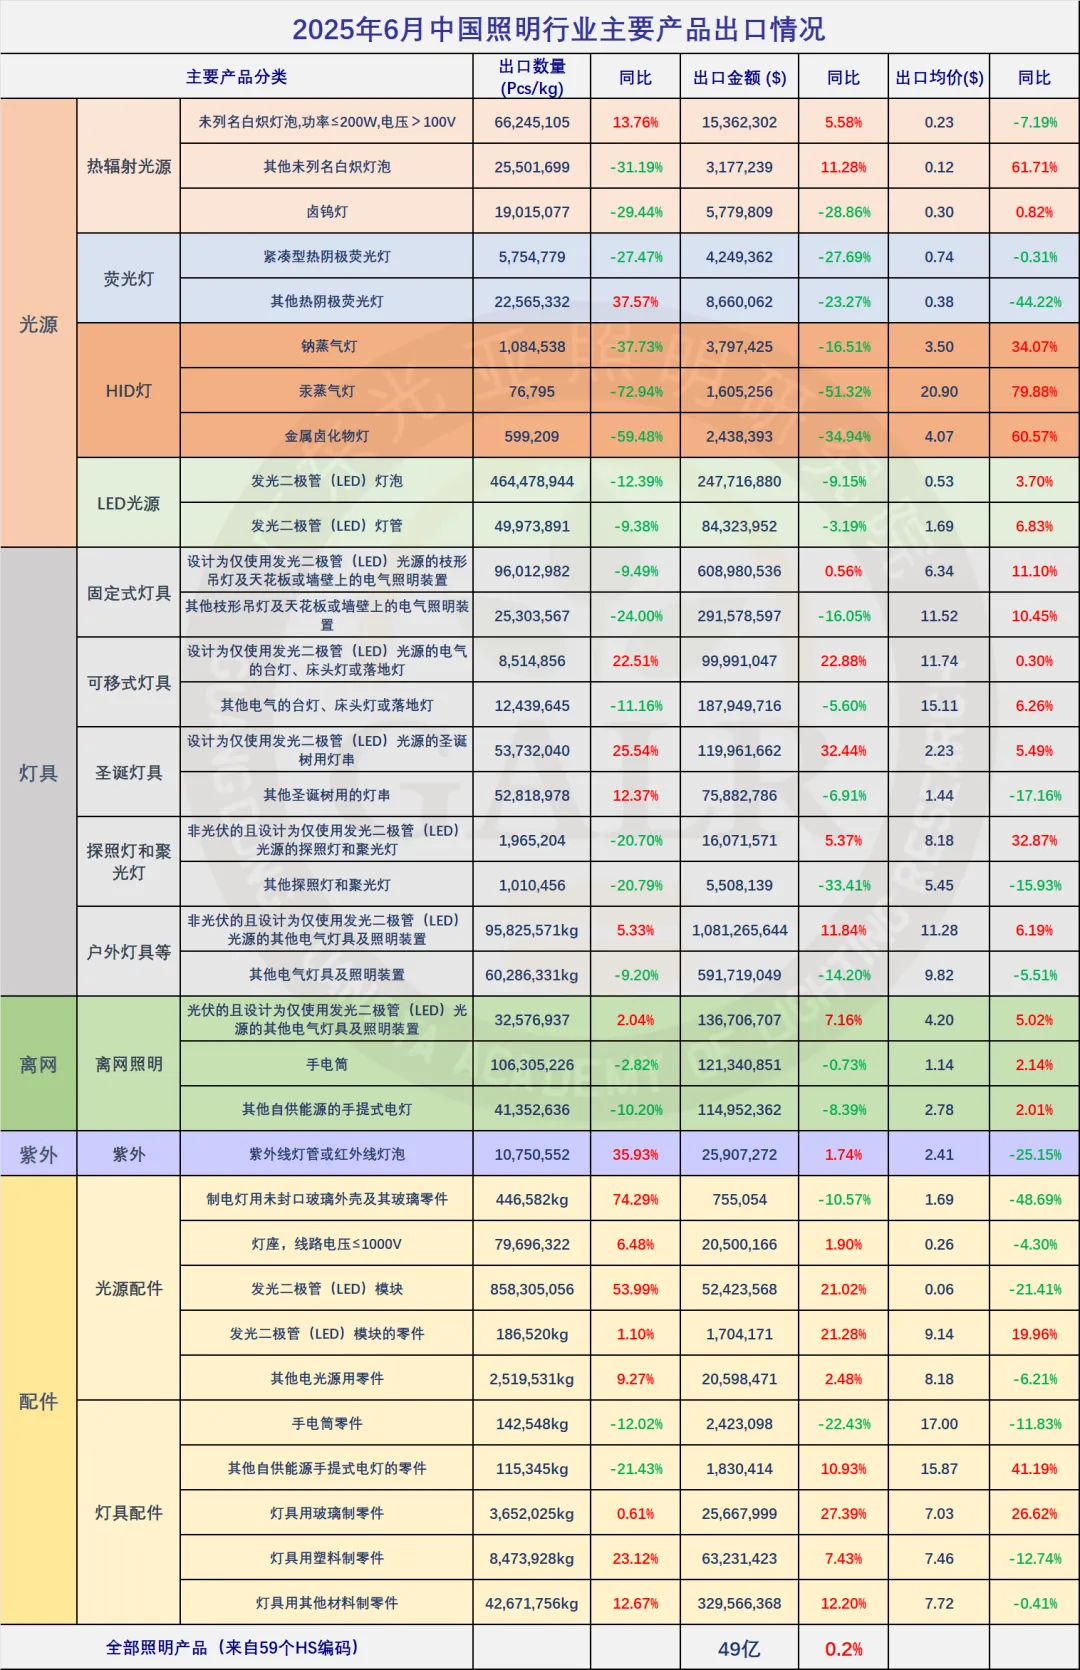
The single-month export value in June 2025 was USD 4.9 billion, with a Year-on-year (YoY) increase of 0.2%, compared to the previous value of -8.1%, marking a stop in the decline and a rebound, mainly due to some enterprises engaging in "rush exports" and "rush transit exports" during the tariff transition period between China and the US. Meanwhile, it increased by 7.1% month-on-month; among them, LED lighting products amounted to USD 3.9 billion, with a Year-on-year (YoY) increase of 6.4%.
Major lighting product Export in H1 2025
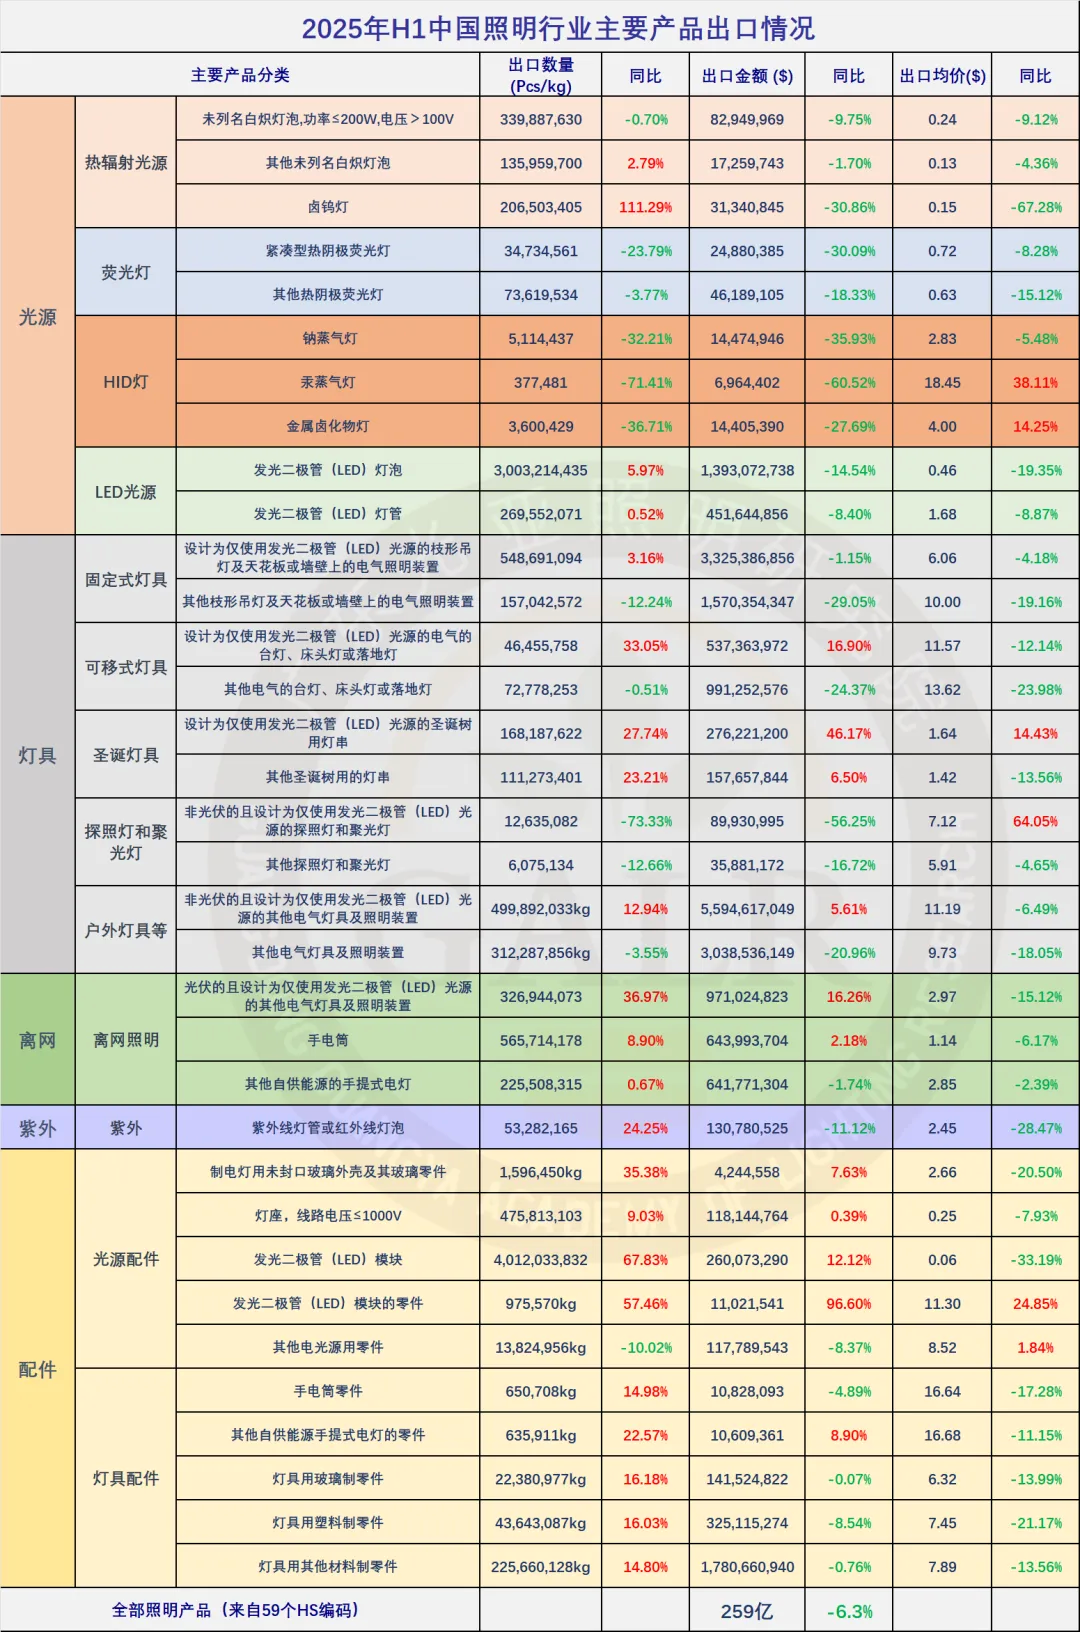
In the first half of 2025, China's total lighting product exports amounted to USD 25.9 billion, a Year-on-year (YoY) decrease of 6.3%, narrowing the decline by 1.4 percentage points compared to January–May; the growth rate for the same period last year was -3.5%. Among them, LED lighting product exports reached USD 20.2 billion, accounting for 78% of total exports, with a Year-on-year (YoY) decline of 1.2%; the growth rate for the same period last year was -3.6%.
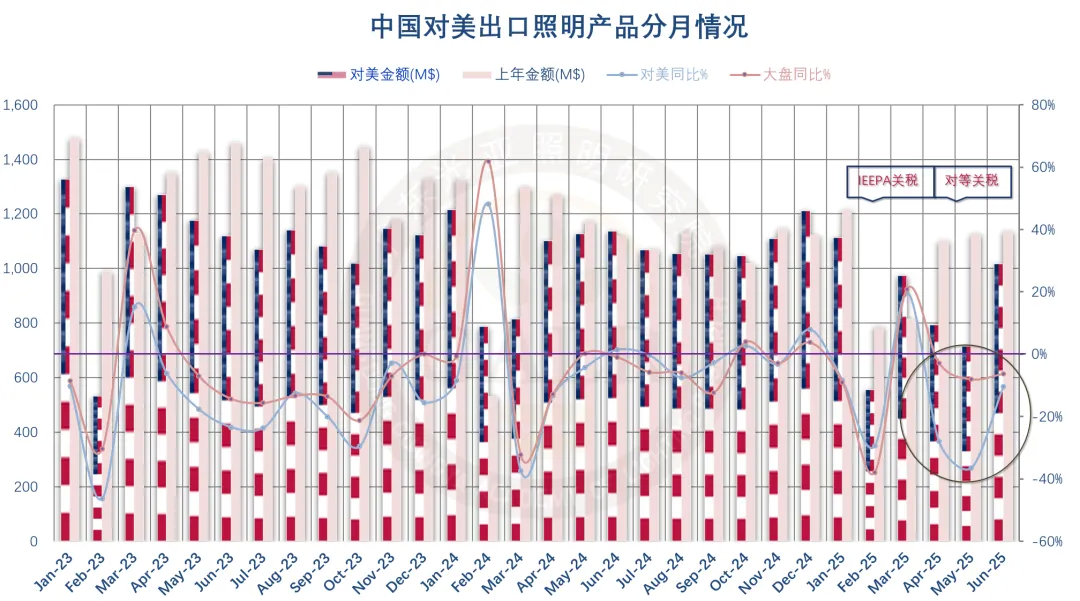
Regarding exports to the United States, in June 2025, monthly lighting product exports to the U.S. amounted to USD 1.02 billion, a Year-on-year (YoY) decrease of 10.5%, significantly narrowing the decline; month-on-month, they rose by 42.3%, accounting for 20.6% of total exports, marking a rebound from 17.6% in April and the historical low of 15.5% in May.
In the first half of 2025, cumulative lighting product exports to the United States amounted to only USD 5.17 billion, a Year-on-year (YoY) decrease of 10.5%, with the share of total exports falling below the 20% threshold.
Monthly Export
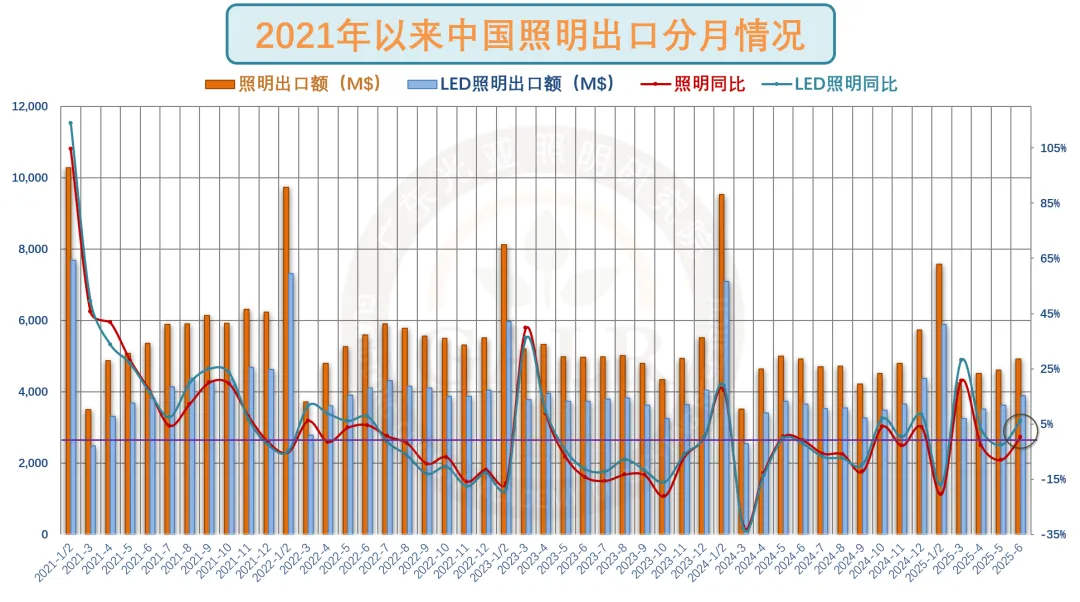
On a monthly basis, in January and February 2025, export value recorded its largest decline since March 2024, influenced by factors such as the high base from the same period last year, disruptions caused by the timing shift of the Spring Festival, and the phased conclusion of the "rush to Export" before Donald Trump's inauguration as president. By March, earlier disruptive factors had dissipated, supply-side bottlenecks gradually eased, and the impact of tariffs had not yet materialized; coupled with the low base effect from March of the previous year, the data showed some rebound. Starting in the second quarter, the impact of U.S. reciprocal tariffs on exports began to gradually manifest, with declines recorded in both April and May, while the decline narrowed in June due to a phased easing of the China-U.S. tariff dispute.
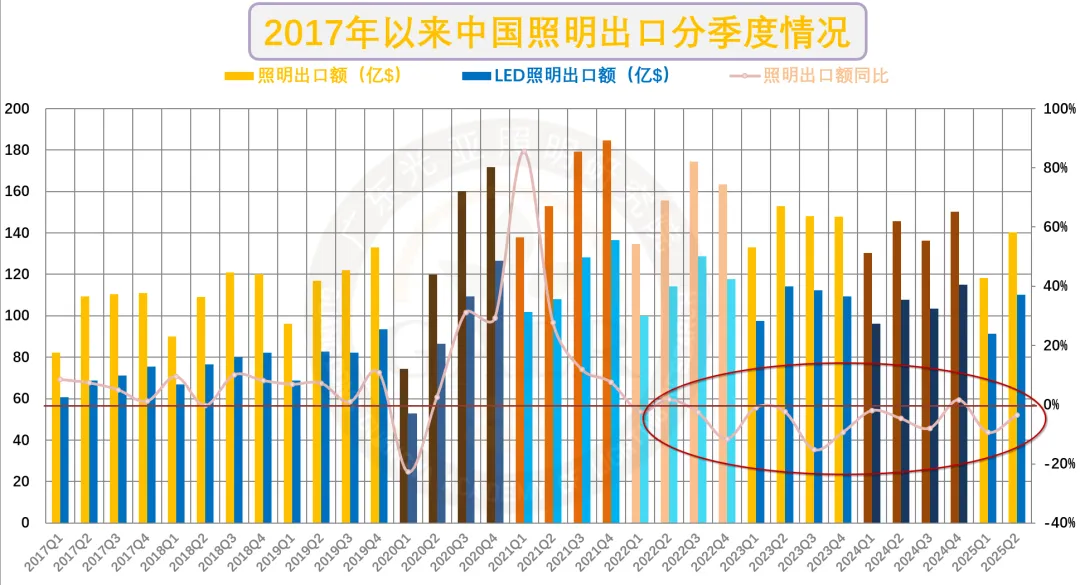
By quarter, in 2024, the first quarter saw a narrowing decline driven by performance in January and February, remaining basically flat with a slight year-on-year decrease of 2.0%; the second quarter avoided a sharp drop due to the absence of volatile comparison bases from the same period in 2023 and seasonal cycle influences, declining only by 4.7%; the third quarter saw the decline deepen to 8.0% against a low base from the previous year; and the fourth quarter returned to positive growth of 1.6% as interfering factors subsided, aided by a low comparison base and pre-holiday "rush to export".
In the first quarter of 2025, the rebound in March alone could not offset the impact of the sharp decline in January and February, recording -9.3%; in the second quarter, dragged down by the superposition of US IEEPA tariffs and reciprocal tariffs, it declined by 3.6%.
Thus far, among the 14 quarters since 2022, only Q2 2022 and Q4 2024 showed positive growth, while all other quarters experienced negative growth.
First, the LED replacement space is further compressed. In the first half of 2025, the share of LED light sources exceeded 80%. The compressed replacement space and the long lifespan of LEDs have both limited incremental demand to some extent.
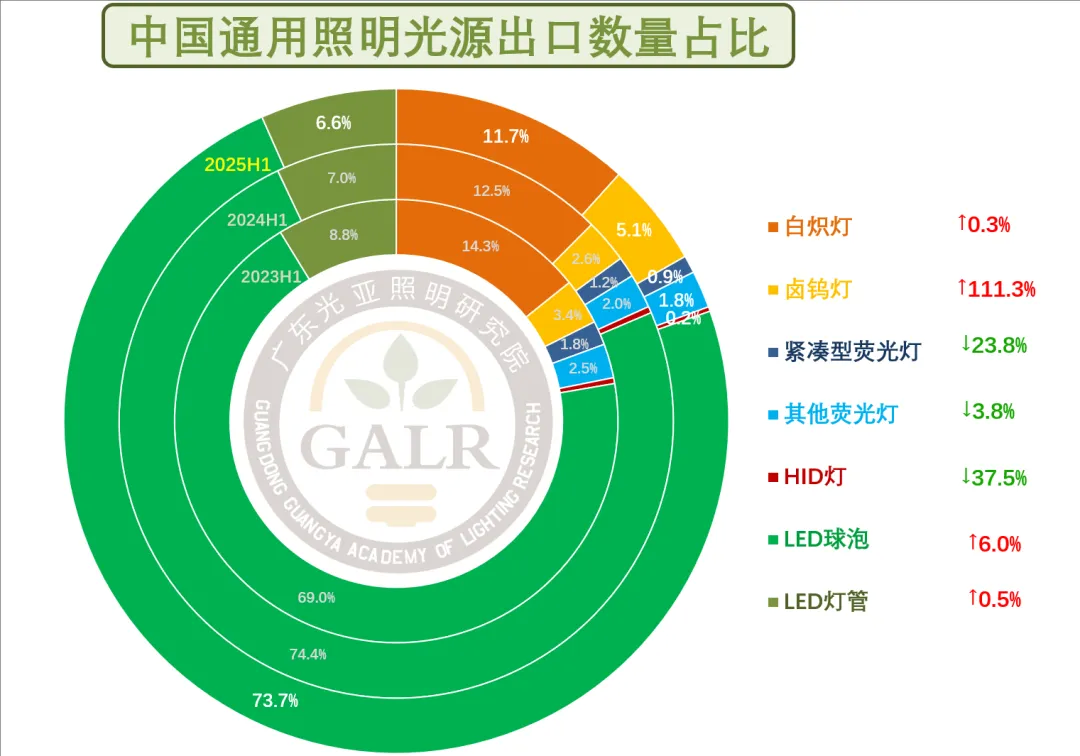
In recent years, with the continuous improvement in the cost-performance ratio of LED replacement light sources, coupled with restrictions on high-energy-consuming traditional light source products in various countries, the replacement of traditional light sources by LED replacement light sources has accelerated.In the first half of 2025, the total Export volume of various light source products was 4.07 billion units, a Year-on-year (YoY) increase of 6.9%, including 800 million units of traditional light source products; LED replacement light source products reached 3.27 billion units, a Year-on-year (YoY) increase of 5.5%.
It should be noted that, the number of Tungsten halogen lamp surged abnormally in the first half of 2025, driven by Vietnam and Cambodia, with volumes of 66 million and 74 million units respectively in the first half, accounting for 68% of the total, representing Year-on-year (YoY) increases of 270% and 979% respectively, while the unit price was only USD 0.01, indicating unsustainable growth. Without this anomaly, the share of LED light sources would have been higher.
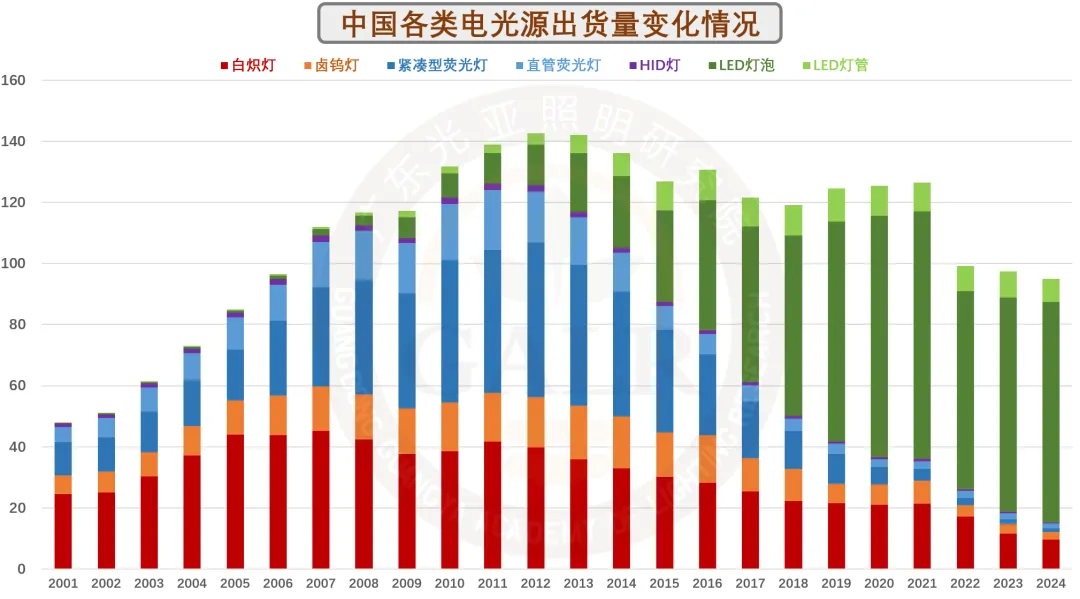
From the current product structure of light sources, after a process of trade-offs, it also means that the space for substitution is further compressed. This is a technical constraint on incremental growth.
Regarding export regional markets, Europe, Southeast Asia and Africa performed better than the overall average, but North America, which was acceptable in the first quarter, as well as West Asia, East Asia, South Asia, Central Asia and Oceania markets all declined by double digits.
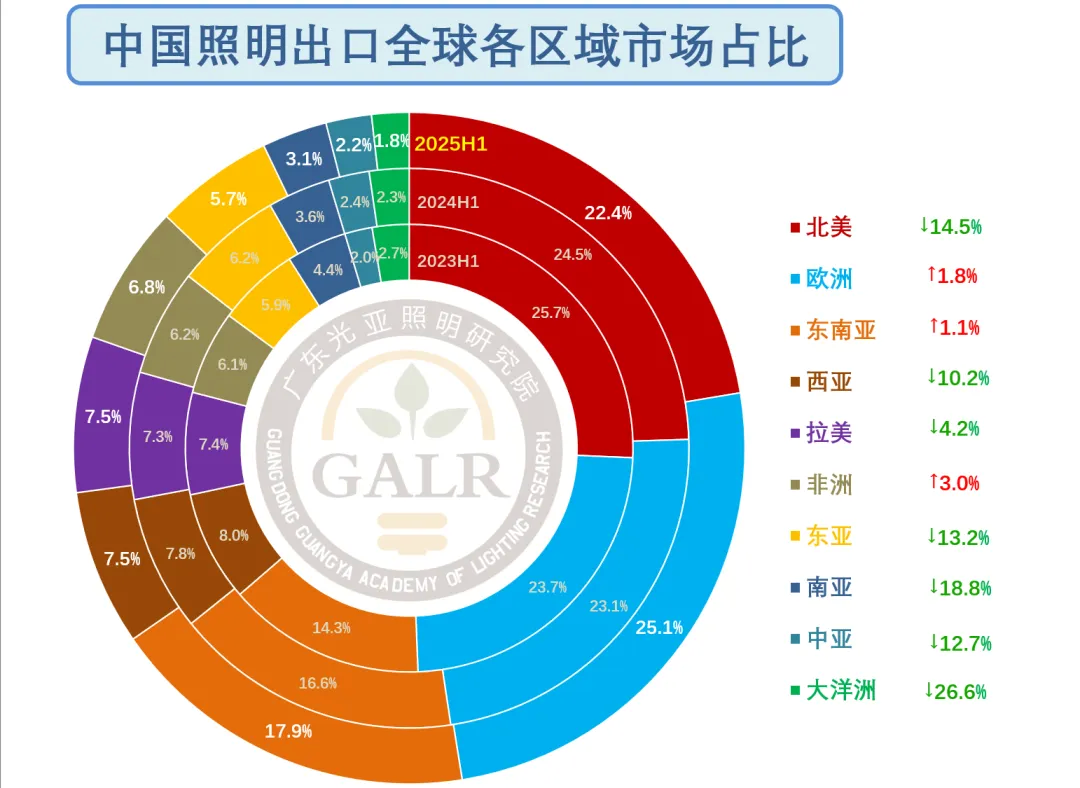
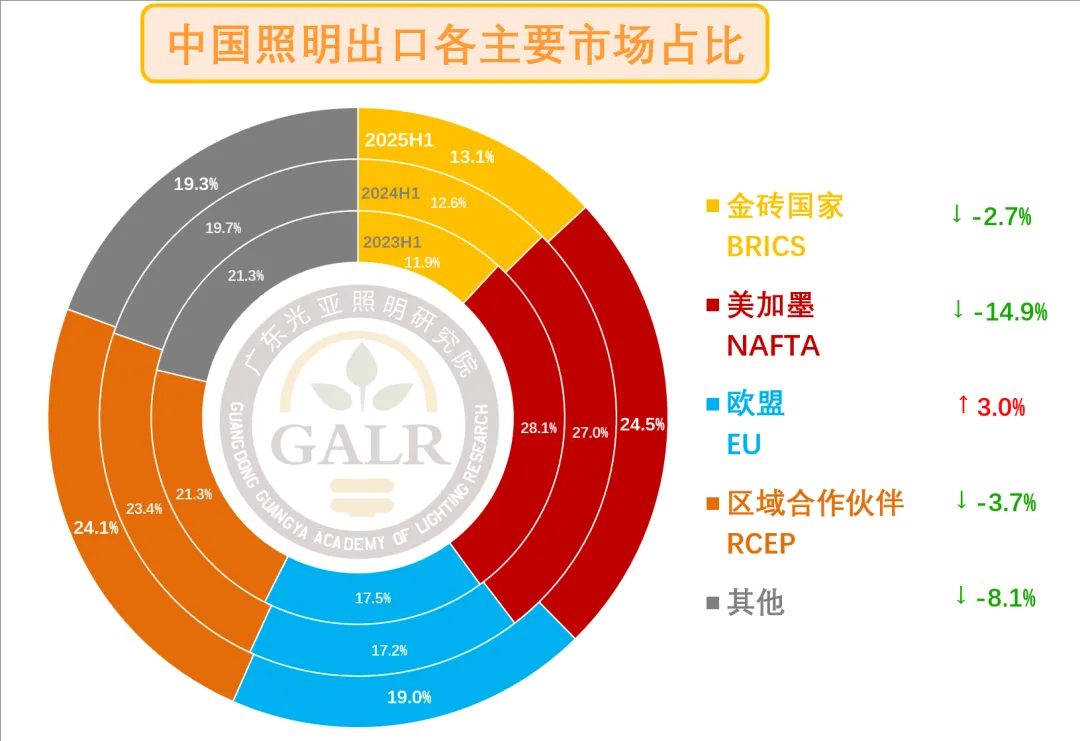
Performance in various regional markets was lackluster; this is a market-driven incremental bottleneck.
In the first half of the year, markets in developed economies diverged, with Europe performing better than the broader market and some emerging economy markets. The North American market, significantly affected by tariffs, along with the East Asian market where Japan and South Korea are located, and the Oceania market including Australia and New Zealand, declined markedly, becoming a drag on the overall performance.
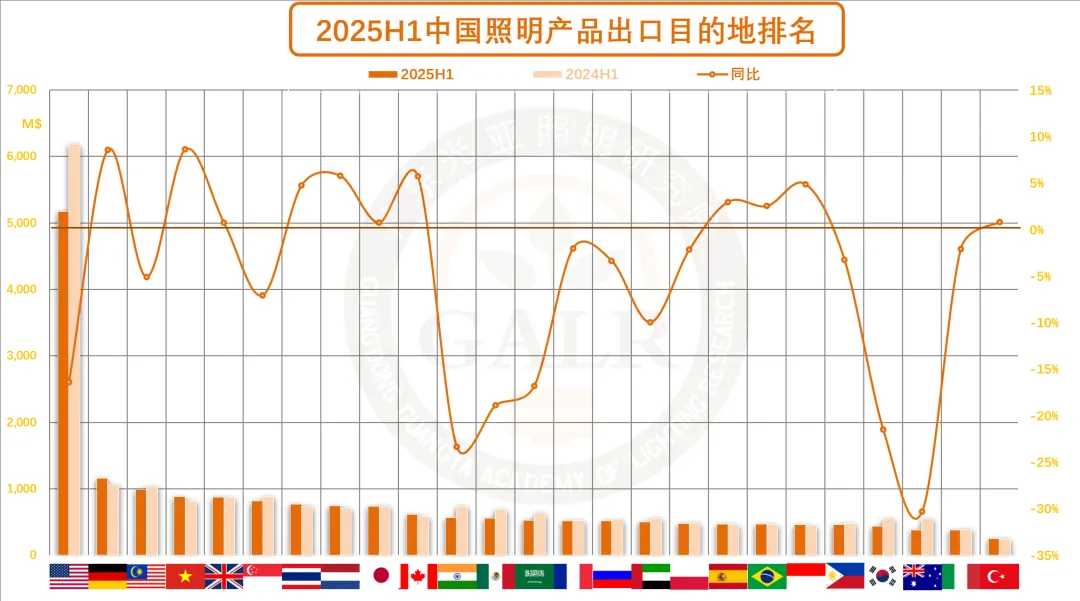
Specifically, looking at the top 25 single-economy markets (accounting for over 76% of total exports), the results are mixed. Among developed economies, performance was mostly slightly better than in the first quarter, excluding the United States; Germany, the UK, the Netherlands, and Spain in Europe all recorded slight growth, driving the European sector; Japan in East Asia and Canada in North America also saw minor increases; while South Korea and Australia experienced significant declines. Among emerging economies, Vietnam, Thailand, Indonesia, and others in Southeast Asia achieved growth, representing one of the few highlights.
The "substitution effect" during the pandemic is gradually receding, and the partial spillover of production capacity and supply chains caused by the radical promotion of global supply chain restructuring centered on "friend-shoring" and "near-shoring" by Europe and the US, combined with the impact of large emerging economies pursuing "localization of manufacturing" and "localization of production capacity", has posed unprecedented challenges to China's position as the global manufacturing center of the lighting industry, and its original market share will face a new round of fierce competition.
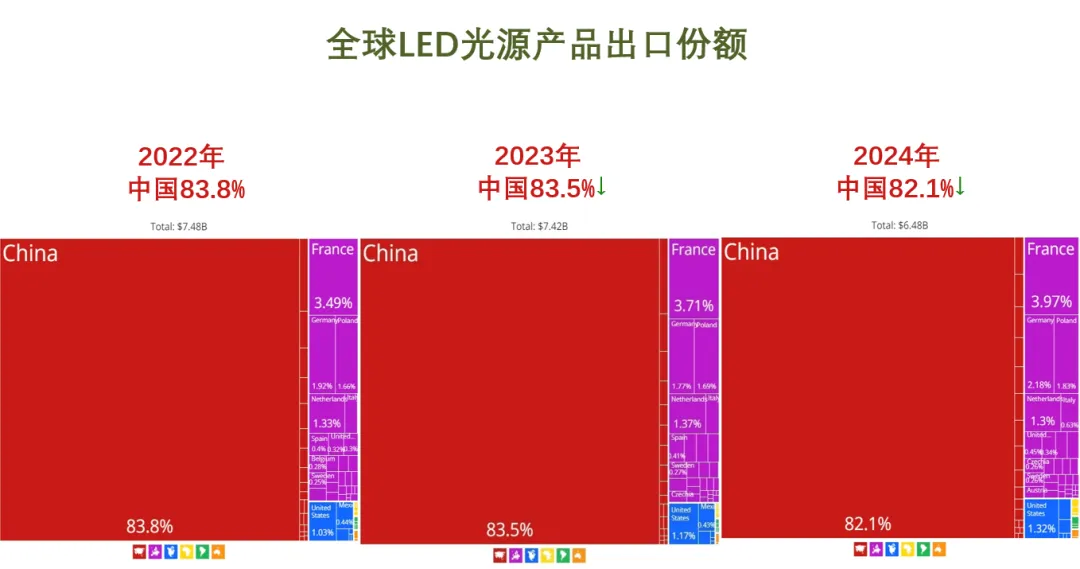
Compared to luminaires, China's position as a manufacturing center for LED light source products is relatively stable.
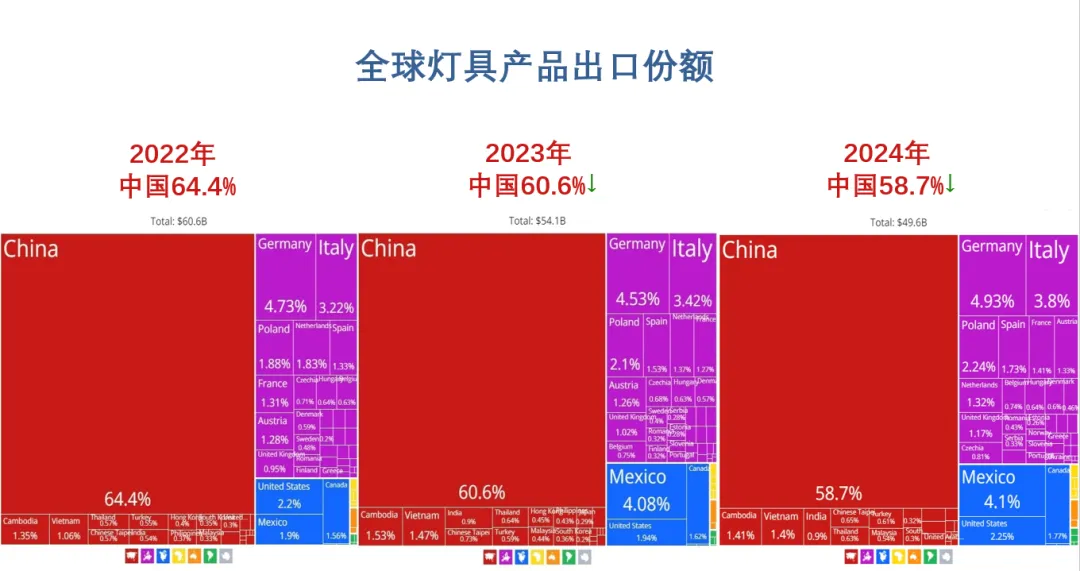
China's status as the global lighting manufacturing center is facing unprecedented challenges, and in the future, it needs to better leverage the advantages of its supply chain hub
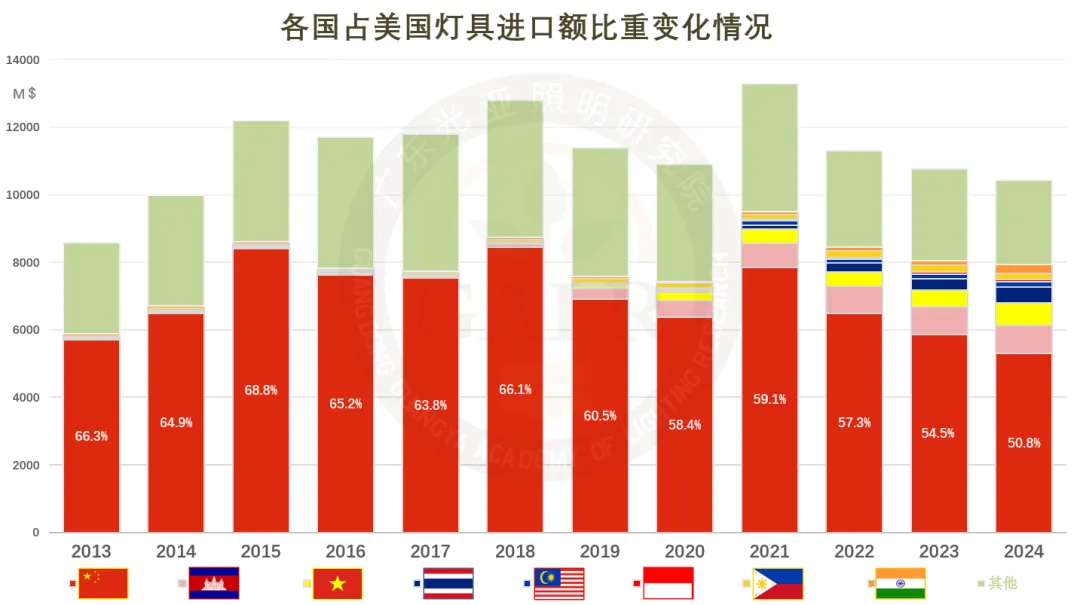
China's share of US luminaire imports has declined from nearly 70% at its peak before 2018 to 50%, while the share of Southeast Asia and India has risen from less than 2% to over 20%
Among traditional strong provinces for lighting exports, Guangdong Province and Fujian Province have shown relatively sluggish performance due to the spillover of production capacity and industry chains.Due to their huge volume, they have dragged down the overall trend; Guangdong's share of the total has fallen from over 40% before the pandemic to one-third, which is also due to the impact of significant spillover of US-bound luminaire production capacity and industry chains from lighting enterprises in the Pearl River Delta and Minnan Triangle.
In addition, driven by the continued prosperity of border trade with Mongolia, Central Asia, and Russia, data from non-traditional strong export regions such as Inner Mongolia, Xinjiang, and Heilongjiang continue to grow significantly, but due to their small size and low cargo value, their contribution to the overall growth is negligible.
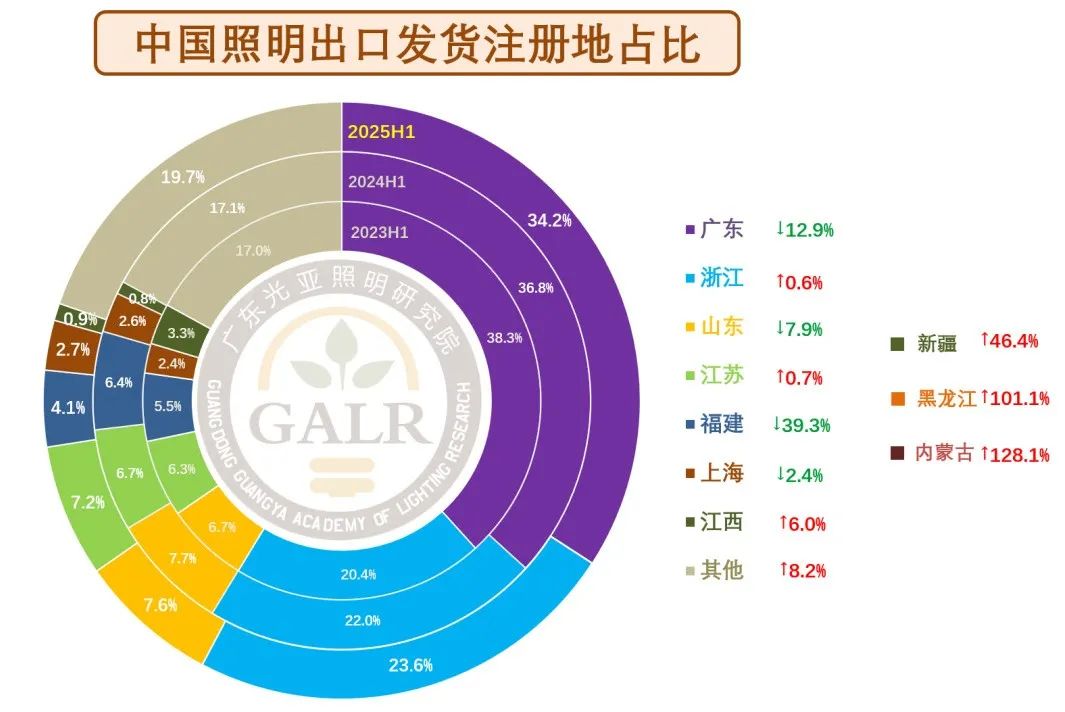
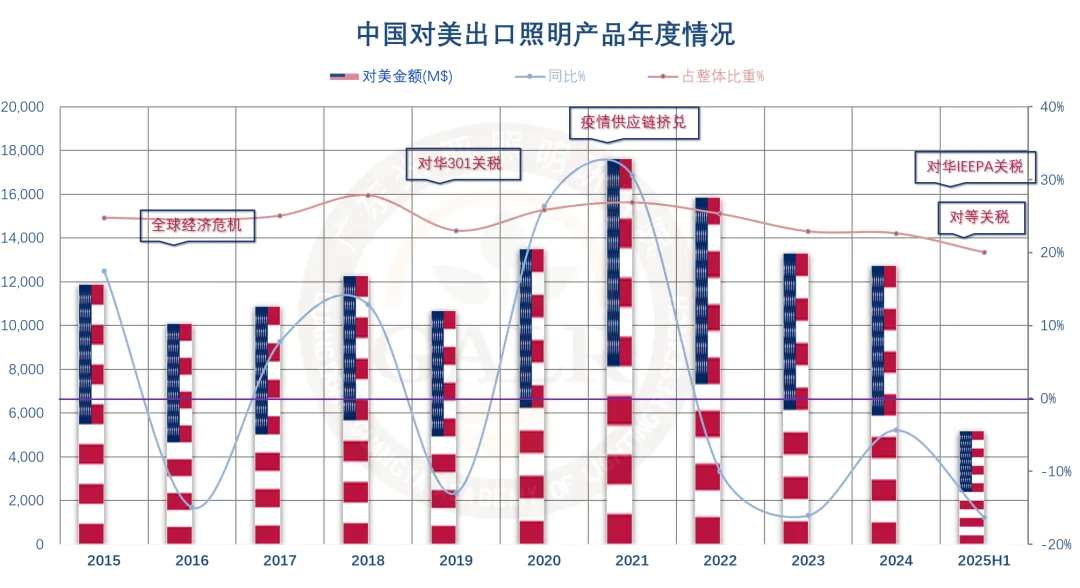
In the first half of 2025, the share of China's lighting product exports to the US fell below the 20% threshold for the first time
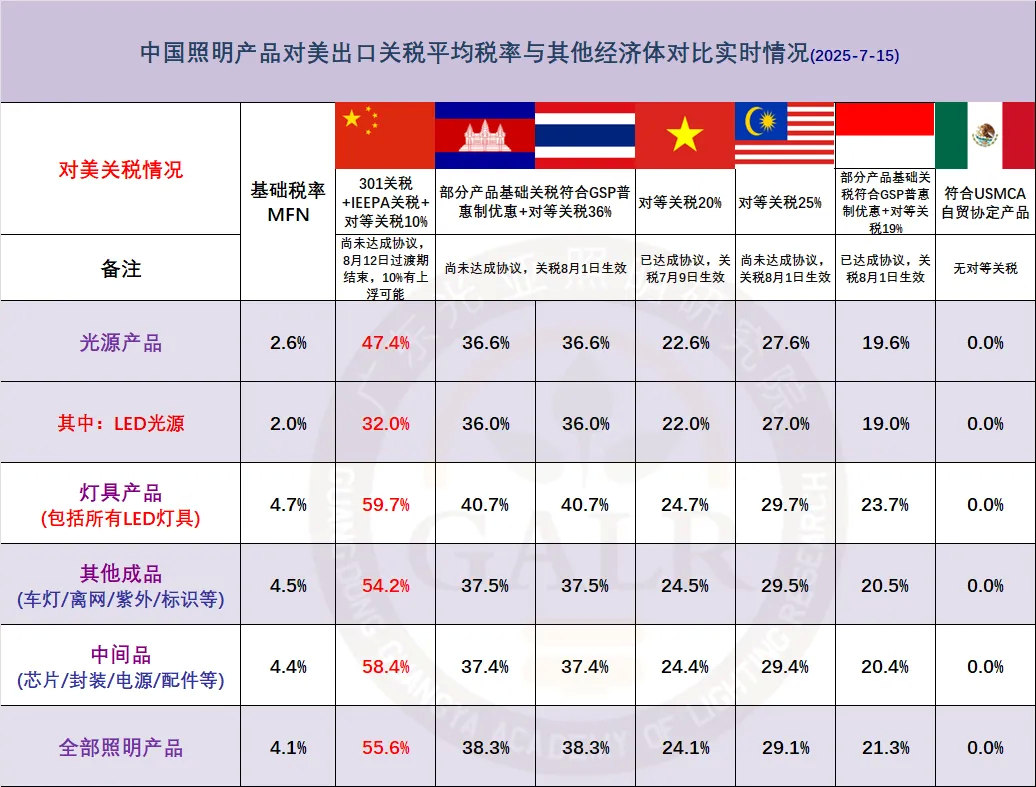
Compared with other major economies experiencing production capacity relocation, China’s tariff rates on lighting products exported to the US remain high
The tit-for-tat tariff “fight” between China and the US in April pushed many exporters to the brink; on May 12, the China–US Joint Statement in Geneva brought a turnaround to Sino-US trade, which had nearly stalled. However, the existing 10% reciprocal tariffs,叠加 the previously unremoved Section 301 tariffs and two rounds of specific tariffs under IEEPA (International Emergency Economic Powers Act), keep the current tariff rates on low-margin lighting products exported to the US abnormally high. The escalation of tariffs not only directly affects exports to the US, but also exacerbates supply chain disruptions and continues to squeeze production capacity and accelerate the spillover of the industry / supply chain abroad.
Unlike the domestic market where both sales volume and prices are falling, a significant factor in the decline of export scale is price deflation. In the first half of the year, the average export price for 90% of product categories declined Year-on-year (YoY), further worsening the overall export situation. Export enterprises commonly report the issue of "increased volume without increased revenue, and increased revenue without increased profit." On the other hand, a consequence of the "rise in the East and decline in the West" trend in foreign trade is that some high-value European and American market shares have been replaced by low-value emerging markets, affecting the total cargo value.
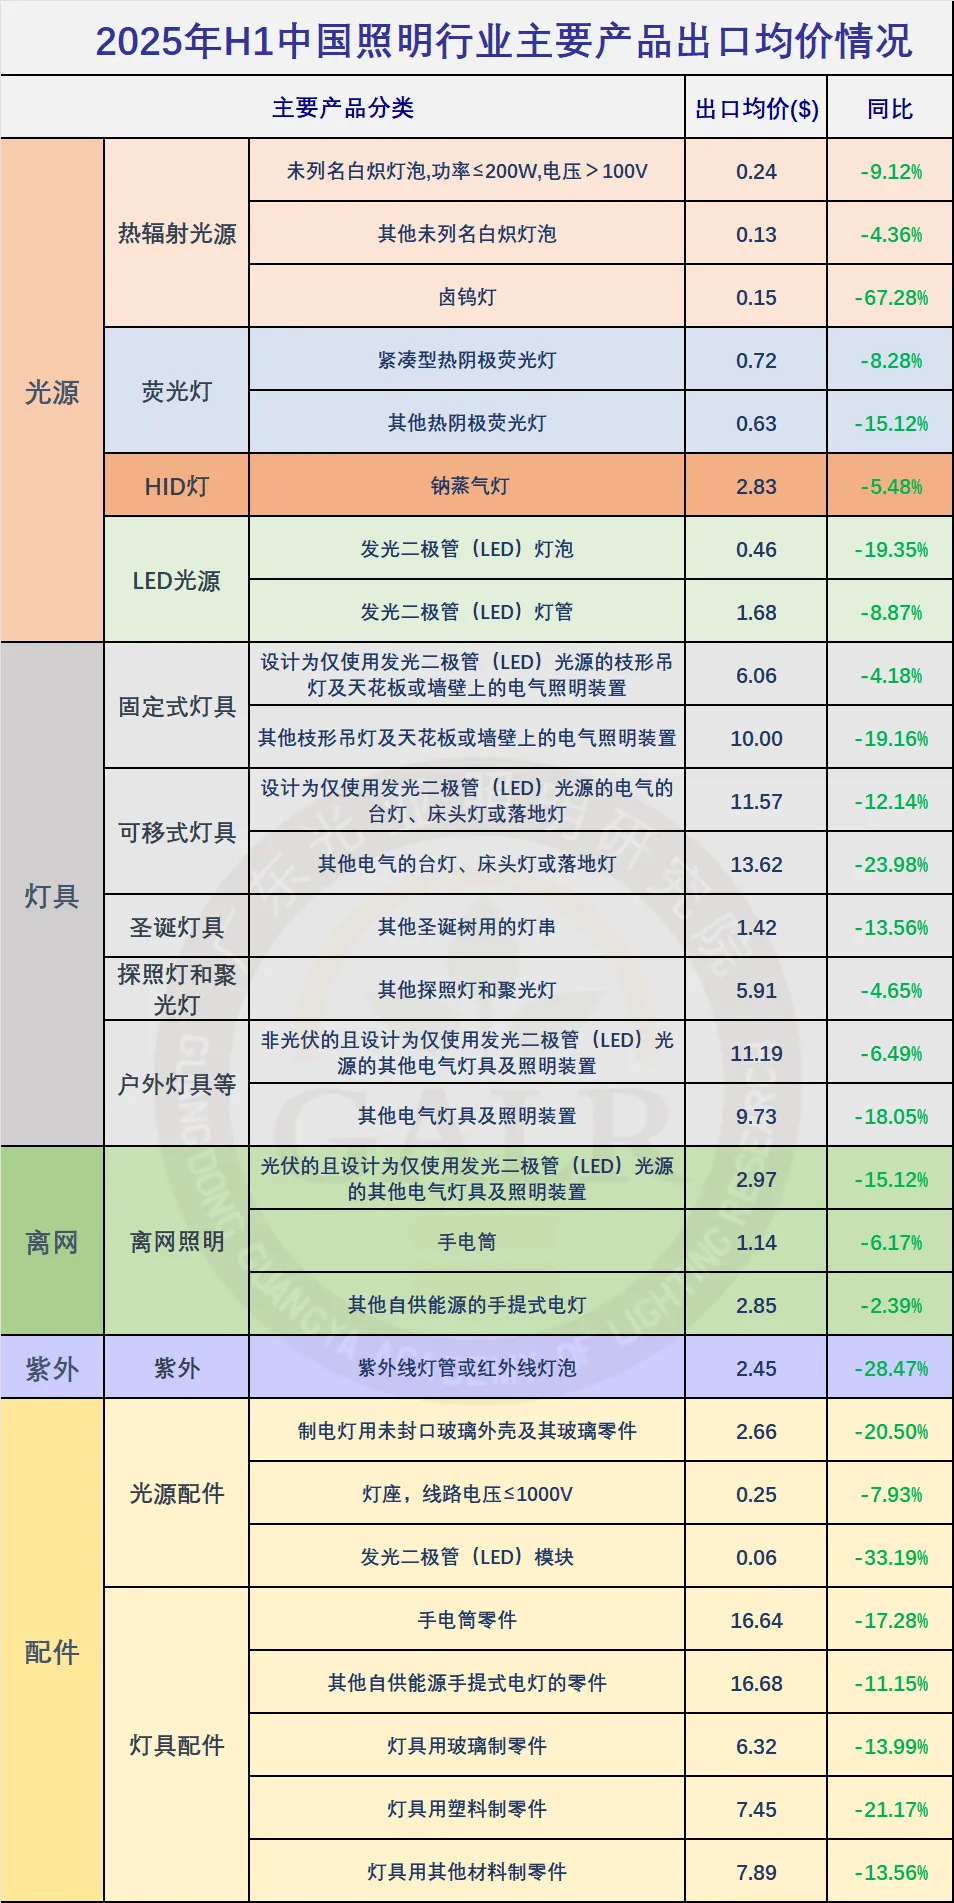
In the first half of 2025, the average export price for most products continued its downward trend
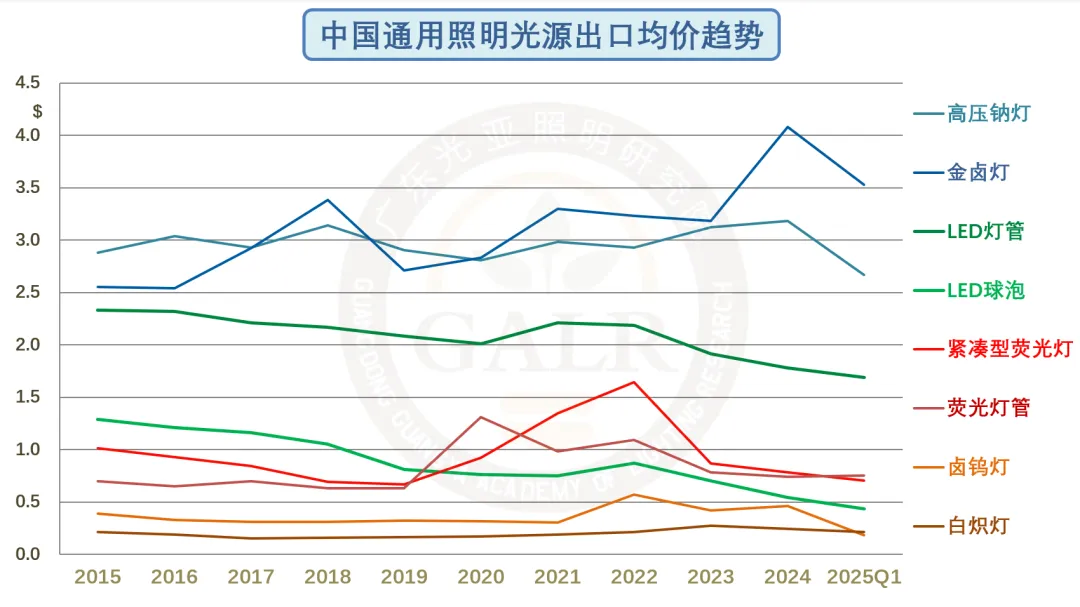
The downward trend in average export prices for LED-related products is obvious and difficult to reverse
Structural overcapacity on the supply side.The lighting industry has long failed to escape homogeneous, low-level, large-scale repetitive production. Coupled with sluggish demand, the industry is currently in a cycle of severely insufficient Production capacity utilization, with the average Production capacity utilization of downstream finished-product enterprises hovering around 50% for years. Sluggish demand on the demand side has also led more companies to choose price-for-volume strategies, lingering on while further intensifying involution. Overcapacity and severe involution ultimately torture oneself and benefit others.
Therefore, the severe imbalance between supply and demand is one of the important triggers for price competition. Market-oriented promotion of supply-side optimization and reduction of production capacity will be an important path to promote the sustainable development of the industry.
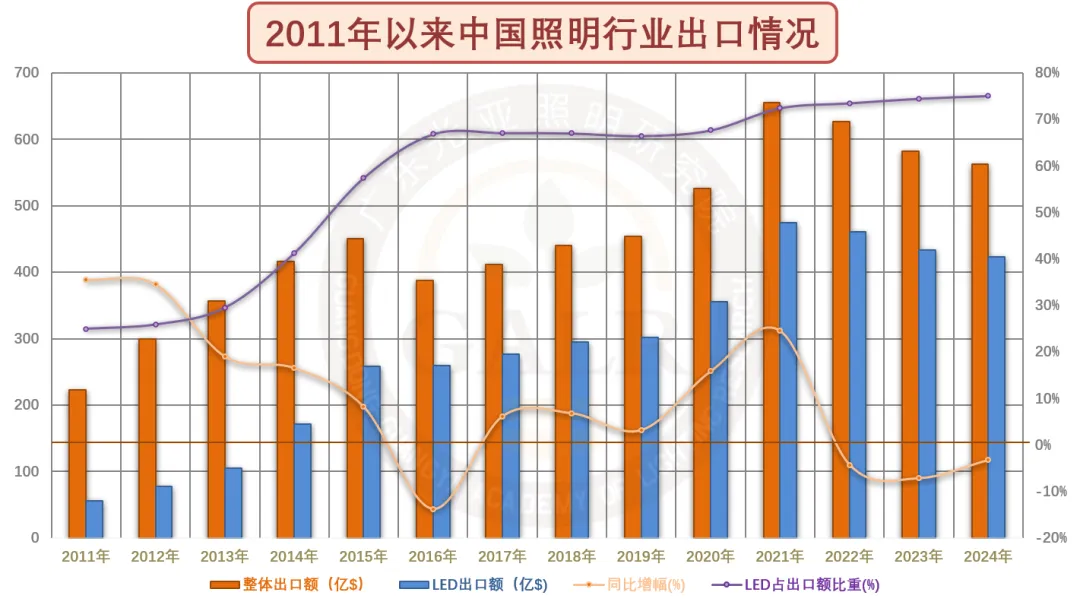
China's lighting export scale has shrunk for three consecutive years since 2021, and it seems difficult to reverse the downward trend in 2025.
Overall,after the high growth in exports in 2021, the overall foreign trade scale of the lighting industry has contracted for three consecutive years, and it is difficult to return to the peak in the short term.The situation of continuous growth has fundamentally changed. In terms of technical increments, the industrial dividends brought by LED source innovation have reached a ceiling, especially in replacement scenarios; market-based increments have also encountered bottlenecks under the pressure of intense domestic competition and external pressures.
Currently, core obstacles include sluggish external demand amid sharply rising globalization uncertainties, spillover and dispersion of production capacity and supply chains, and intensified US-China tariff games, compounded by severe supply-demand imbalance and price deflation caused by the "rise in the East and decline in the West" in foreign trade.
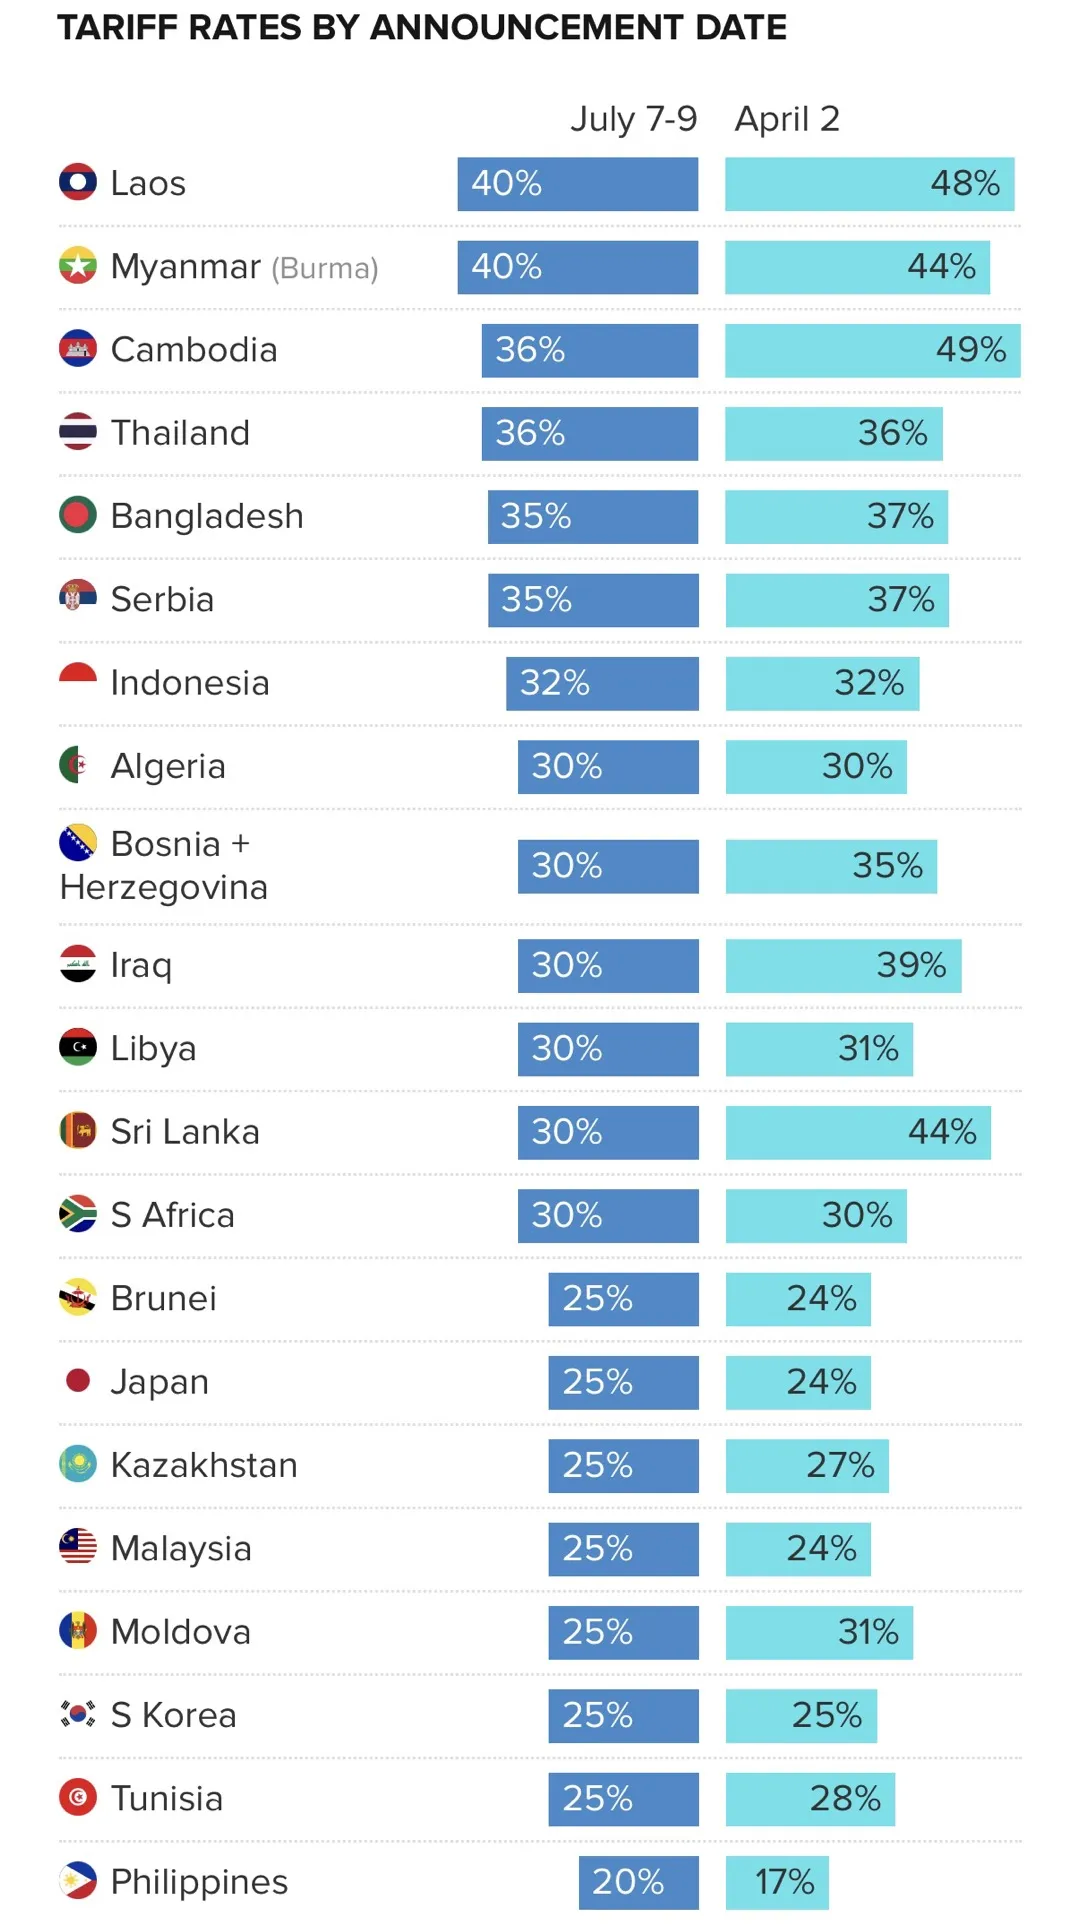
The 90-day tariff transition period is coming to an end, and the tariff rates received by most economies are not ideal
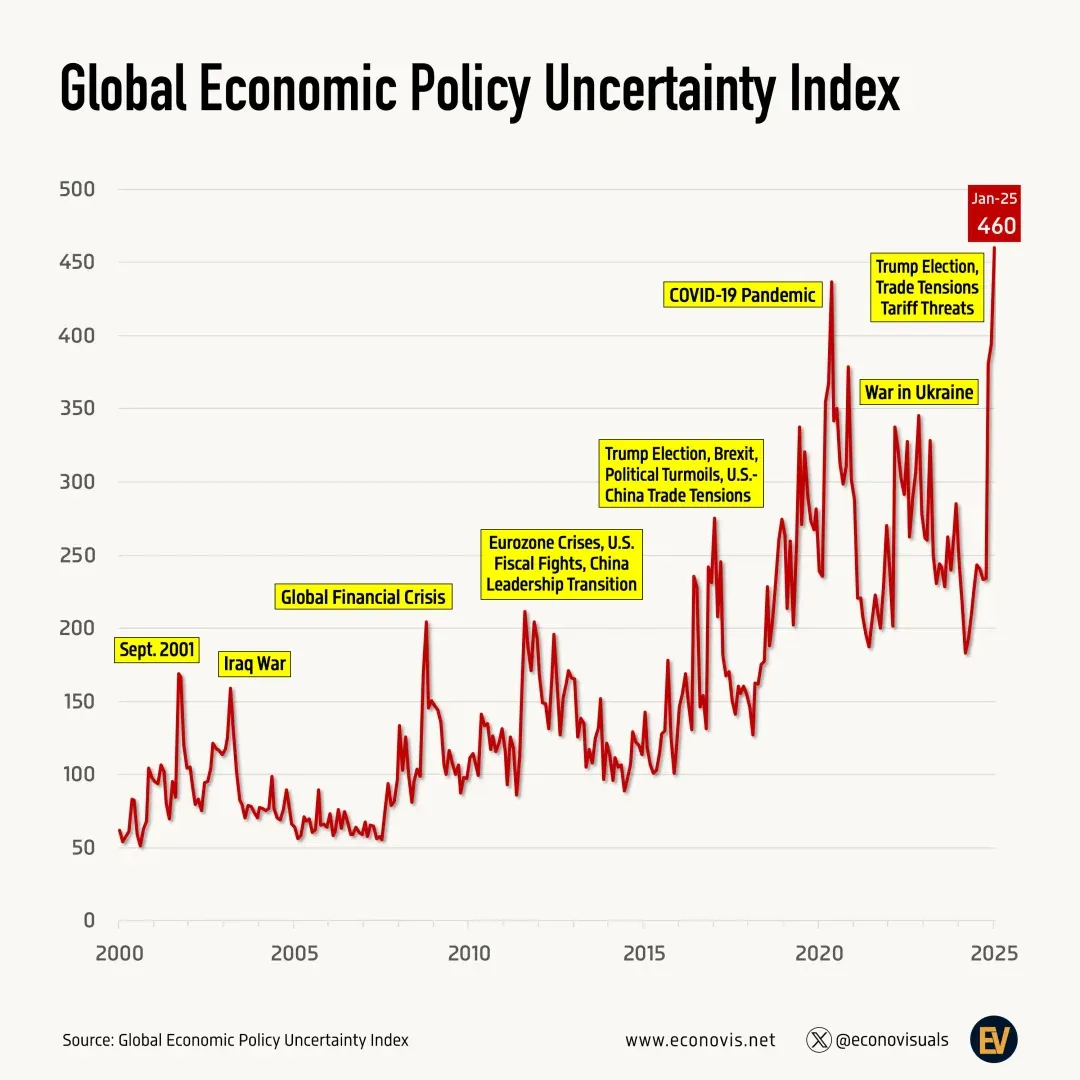
The World Economic Uncertainty Index reached its peak after Trump's second inauguration
Given this trend, it is difficult to say that the overall pressure on lighting foreign trade has fundamentally reversed. The misalignment of the Spring Festival in the first half of the year and the "rush to export" and "rush to re-export" caused by the tariff transition period have, to some extent, overdrawn the demand for the second half of the year. In addition, the uncertainty after the tariff transition period will hinder exports in the second half of the year, making it likely unavoidable that the scale of lighting exports will decline for the fourth consecutive year.
Whether it is the de-risking restructuring of the global lighting supply chain centered on "friend-shoring" and "near-shoring" vigorously promoted by major developed economies, or the "localization of manufacturing" and "localization of production capacity" currently being emphasized by large emerging economies, China's position as the global lighting manufacturing center is facing unprecedented challenges. In the future, China needs to further leverage and strengthen its position as a supply chain hub. At the same time, it should embrace "re-globalization" and firmly follow the path of "openness" and "going global".
The above article is sourced from Guangya Lighting Research Institute, author Wen Qidong
China Light
The official website of the China Association of Lighting Industry and a full-media platform for the lighting sector. We provide authoritative and timely lighting information while striving to be a growth partner for businesses. From brand promotion and channel expansion to consulting, talent training and participation in standards development, we provide comprehensive professional services to help businesses improve quality and efficiency and jointly advance the high-quality development of the lighting industry.
Business Contacts
仇纯 (Ms.): 158 6155 3579
顾君 (Mr.): 137 7157 5253